This blog references an opinion and is for entertainment and informational purposes only. It is not intended to be investment advice. Seek a duly licensed professional for investment advice.
In this 35th Market Outlook here at Ostium Research, we'll be taking a look at the week ahead in markets, focusing specifically on price-action, positioning and event risk for Bitcoin, Ethereum, Gold, DXY and SPX.
Firstly, let's take a look at the calendar, with a light week ahead primarily consisting of speeches:
WEDNESDAY: FED'S BARKIN SPEECH
THURSDAY: US S&P GLOBAL MANUFACTURING PMI (MAY): (CONSENSUS 50.1 VS PREVIOUS 50.2)
THURSDAY: US S&P GLOBAL SERVICES PMI (MAY): (CONSENSUS 50.8 VS PREVIOUS 50.8)
THURSDAY: US INITIAL JOBLESS CLAIMS: (CONSENSUS 230K VS PREVIOUS 229K)
THURSDAY: FED'S WILLIAMS SPEECH
FRIDAY: VARIOUS FED SPEECHES
Now, let's dig into asset-specific price-action for the week ahead, looking firstly at Bitcoin:
Bitcoin:
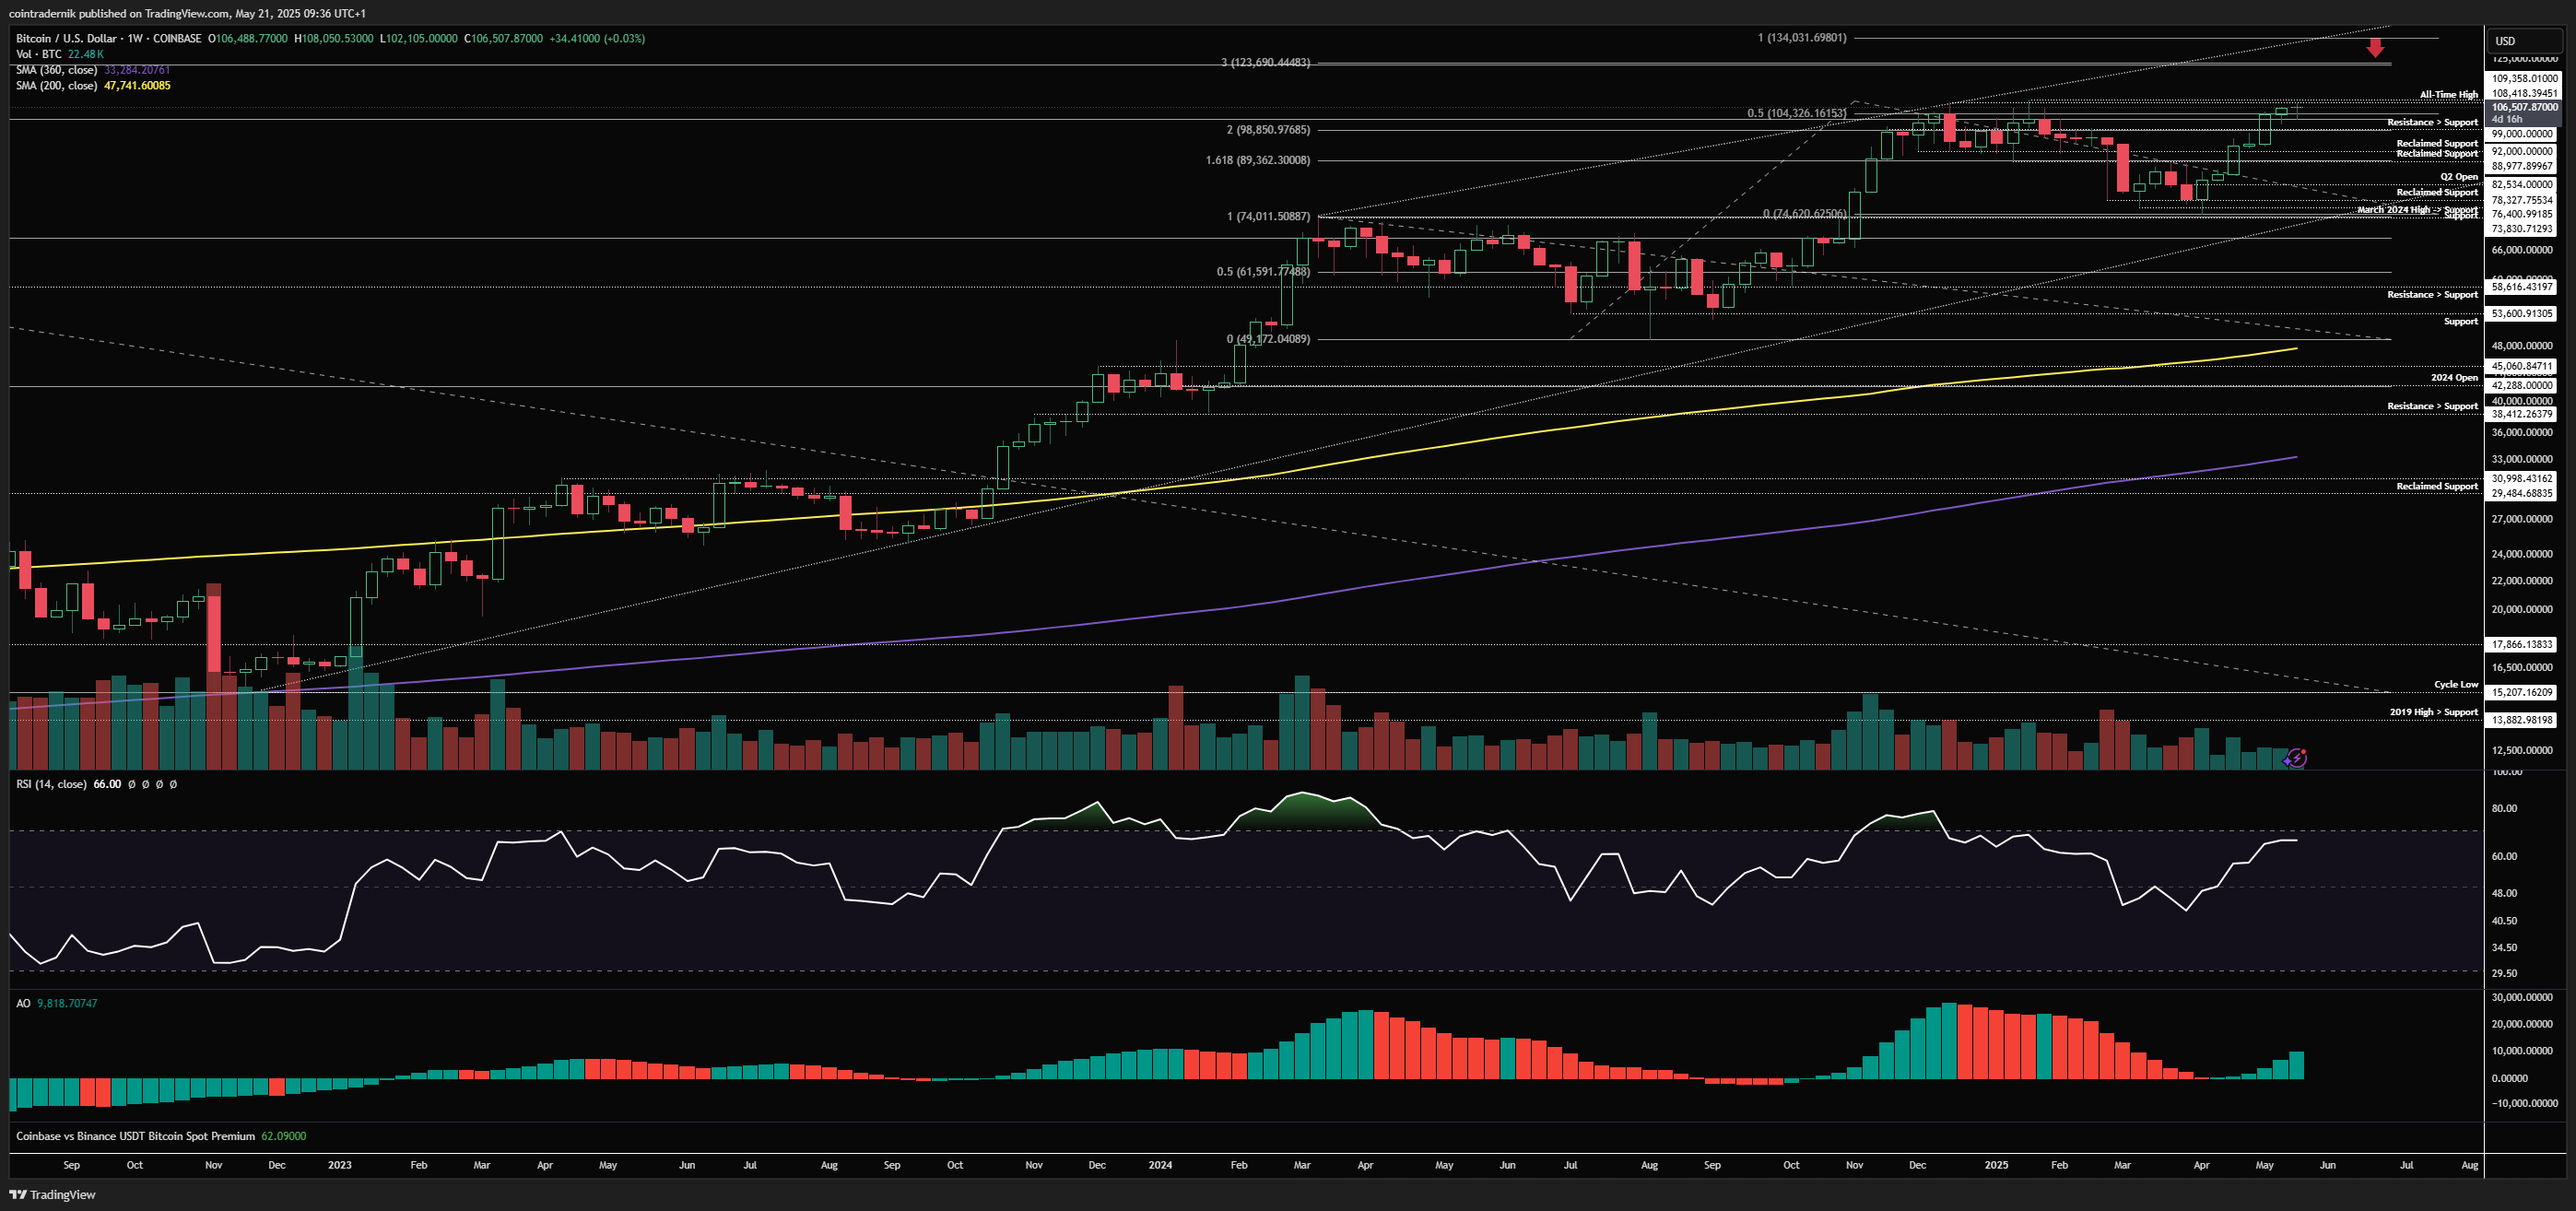
Price: $106,506
Weekly:
If we begin by looking at the weekly for BTC/USD, we can see that there has been much by way of continuation higher following my last Outlook two weeks ago, with price rallying off that $92k range support reclaim all the way into $107k as of this week, just a stone's throw away from new all-time highs. We've seen two consecutive all-time high weekly closes above $104k prior resistance and momentum has been pushing higher - though still not anywhere near extremes. What has been more fascinating is to see just how evidently sidelined much of the market is (both in crypto and equities), with one of the most hated recoveries I can recall in recent times. We are now trading a couple of percent away from price discovery with local resistance continuing to be flipped as support and those awaiting deeper pullbacks continuing to be left waiting. Given this pattern of intraweek price-action from the $74k bottom, I think it is unlikely you see much of an opportunity present itself for longs before new highs are traded - rather, I think it looks like we need to bait breakout longs before you can really fuel much downside, because the shallow pullbacks have such a persistent bid right now. Nonetheless, if we do trade through last week's low back towards $99k over the next week or so, that would be my most generous expectation of an opportune long entry. Looking at current price-action, we saw last week close at $106.5k and I would expect to see that $109.4k all-time high tested this week given this setup, with price so far marginally pushing above $108k. Whether we break free on the first attempt is doubtful - but instead of a deep pullback I think we get more of the darth maul style intraday chop that obliterates the highly levered positioning on both sides before we accept through $110k. When we do accept above that level, I think we trade into $124k within a couple of weeks, with $134k the next level of interest beyond that. Unless we get a deep wick through $110k and then break back below it and reclaim it as resistance, there is zero reason to be bearish into June here.
Daily:
Turning now to the daily timeframe, we can see that the pattern since the bottom has been sideways consolidation, followed by sharp expansion higher, followed by sideways consolidation. This has occurred on growing momentum which has more recently began to show some weakness on the push up over the past few days. We only have one level of resistance left before the all-time high retest and that is $108.4k, where any daily close through that level makes it pretty much inevitable we test $109.4k highs. For those bearish up here, the recent momentum divergence is promising, but remember that in strong trends we can see these divergences blown through before they get a chance to be validated. Nonetheless, should we reject here and then close back below ~$104.3k with daily RSI pushing below last week's low, that would open up a sweep of the $102.5k support and that cluster of untapped lows into $99.4k; this would be your most opportune long entry and not where you want to get bearholed expecting the entire rally to be undone. If you don't get that and you're looking for longs, honestly there isn't really much that looks favourable here as far as risk/reward goes - rather you should wait and see if we get a lot of late longs at $109k that get trapped and then buy their liquidations before the real breakout. Ultimately, I think we are in a similar position October 2024 (and October 2023) here, with a period of price discovery imminent.
I know we are already mid-week but there are potentially some favourable setups that could present themselves, with shorts favourable if we get bearish divergence into an all-time high sweep and rejection (particularly if derivatives look like longs are trapped up there). We could look to short on a trendline breakdown or just on acceptance back below $108.4k, looking for at least Tuesday's low to be swept into support at $104.3k:
On the long side, there's nothing interesting right here, but if we do continue to correct here without sweeping the highs this week, we could look to blind bid $104.4k and add back above $105.1k, looking for that $109.4k level to be tested into the weekly close or early next week:
And here's a snapshot of positioning across Velo and CoinGlass:
And here's 3-month annualized basis, which remains low:
I've also included Dominance by Open Interest below, which shows Bitcoin OI vs Altcoin OI:
And finally some anticipated 1-week and 1-month liquidation levels:
Ethereum:
Price: $2543
ETH/USD
Weekly:
Beginning with the weekly for ETH/USD, we can see that price traded into our target at $2077 from the $1730 longs and then sliced through every prior support turned resistance level like butter, erasing months of downside in a weekly candle and validating the reclaim of multi-year range support at $2158. That level is now the level - hold above that and ETH is bullish and likely headed towards 2024 highs and $4093 over the coming months; close the weekly back below $2158 after this explosive reversal and this is a major bull trap from which we likely take out the $1420 lows. For now, price is consolidating right around that 200wMA and below the Q4 open at $2600, with support below at the 2024 open at $2281. Momentum has pushed back above 50 on weekly RSI, which is promising, and should price now close above $2600 I would expect to see continuation higher into $2850 as the next resistance level. The final level of major resistance to overcome in my view is trendline support from the bear market bottom, which is confluent with that range between $2850 and $3050 at present; above those levels I don't think the 2025 open is much work and we move swiftly higher into the $4xxx area. This all hinges on any weakness leading to a higher low above that $2077-$2158 area, with $2158 holding firm on the higher timeframes.
Daily:
Looking at the daily, we can see that price rejected at the confluence of the 200dMA and 360dMA after that strong run-up, with the pull-back then sweeping $2394 support and holding firm, with daily RSI having reset somewhat. We have scope now for another test of the 200dMA at $2700, where any acceptance above this level leads to that push into the $2850-$3050 range that I expect to provide a little stronger resistance on the first attempt. Daily structure is bullish and momentum is supportive of higher prices here, with no trend exhaustion as of yet. If you do get the opportunity to long a sweep of last week's low into that $2158-$2281 region, that's a golden ticket in my view with very clean and tight invalidation. Acceptance above $3050 = $4093 within a few weeks.
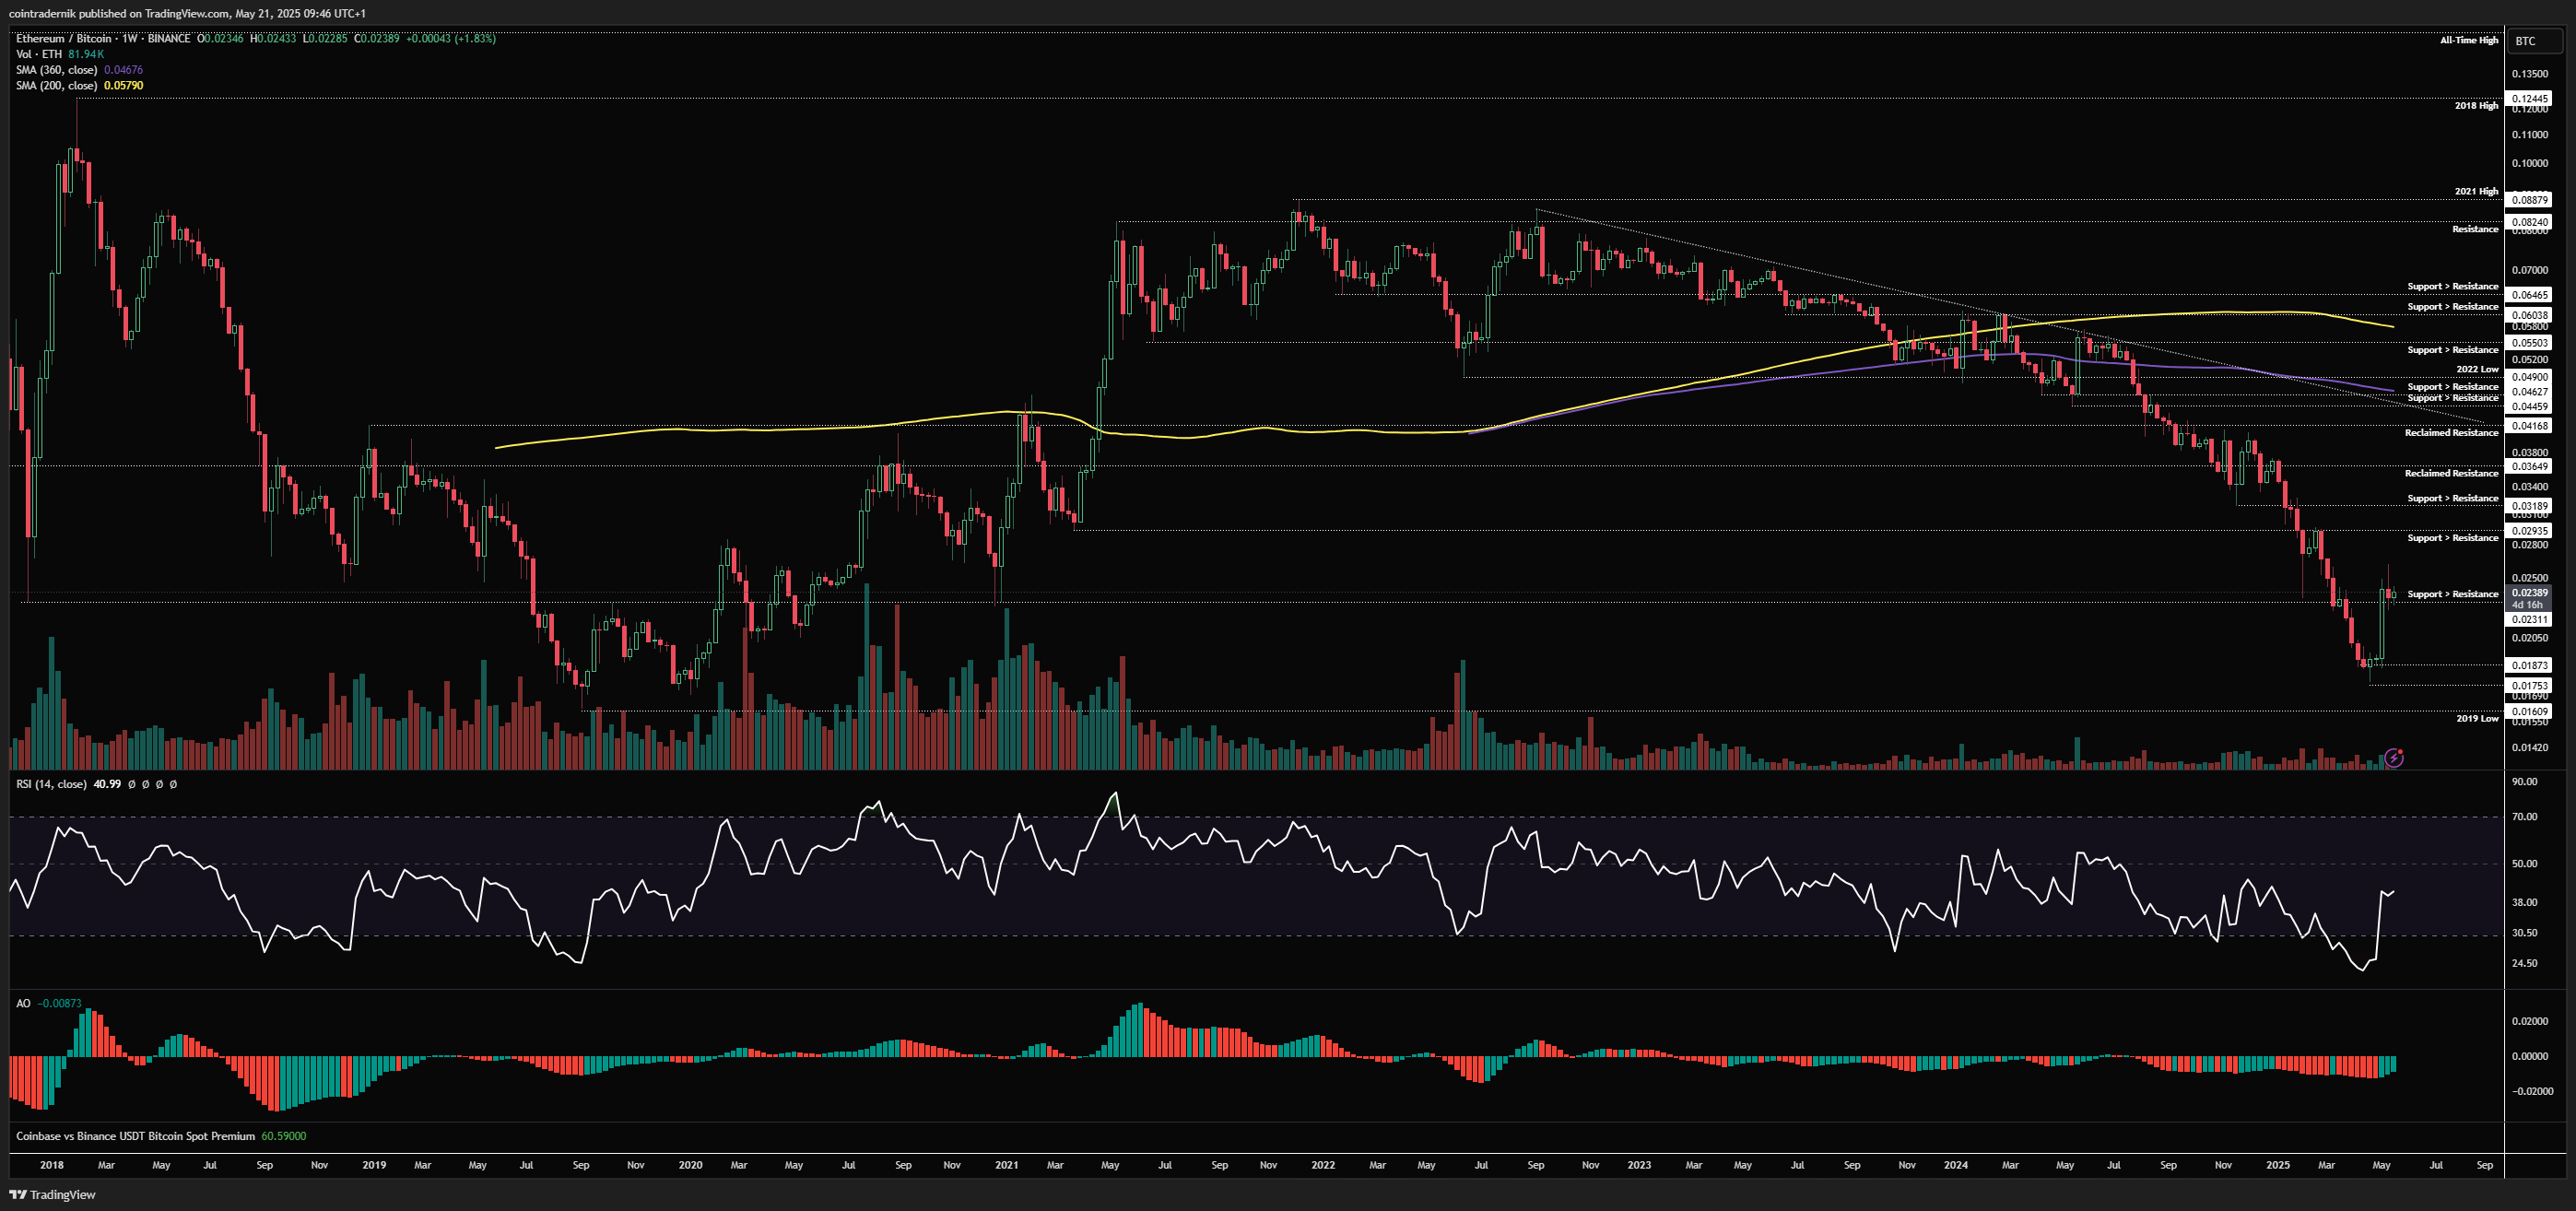
ETH/BTC
Weekly:
Looking now at ETH/BTC, we finally got the candle we needed to see for some sense of demand, with price pushing off that 0.0187 support level all the way back above the key 0.023 level within one week, now consolidating above that level as potentially pivotal reclaimed support. If this level can now hold, I would expect similar price-action to follow for the pair as that which followed in December 2017 and December 2020 off this level - a sharp reversal. 0.029 is the next level of interest, where any close above that would turn weekly structure bullish, and subsequent to that I would expect the squeeze to persist into 0.0365 at least, if not 0.0417. Flip 0.023 back into resistance and we erase this rally back towards 0.0187.
Daily:
On the daily timeframe, we can see that whilst it took a couple of weeks more consolidation to play out, the trajectory marked out in April ultimately did play out, with price finding support at 0.0187 and then rallying hard off that level on good volume through trendline resistance, with momentum firmly in an uptrend and looking very different to the past six months or so of price-action. The pair pushed as high as 0.0265 before finding resistance and is now marking out a higher-low above 0.023, which is the key level to hold. Pushing higher from here opens up that 200dMA retest at 0.029, with the 360dMA at 0.0365 the major test beyond that - a key moving average which hasn't been traded above in well over a year. I bullieve in you, ETH bulls.
Subscribe to Ostium Labs
Receive the latest updates directly to your inbox
Your subscription could not be saved. Please try again.
Your subscription has been successful.
Gold:
Price: $3308
Weekly:
Beginning with the weekly for Gold, we can see that price put in an all-time high at $3500 and then rejected, retracing as deep as $3120 in a multi-week consolidation as momentum as reset. We saw peak mindshare for Gold into that high and thus I continue to expect it to hold for the foreseeable future, and price is currently failing to close beyond $3330 on the weekly. If we do close above that level, then it becomes more probable that we push back into $3500 for the retest and potentially make another leg higher into $3700, where we may see some higher timeframe trend exhaustion. I place around a 30% probability on this scenario and remain short Gold as a pair trade for my BTC long. More likely, in my view, is that $3500 holds as the high through Q2 and we make another leg lower in Gold towards $2950 for that retest, marginally above which I would be looking to take off the short Gold leg of my pair trade and be naked long BTC.
Daily:
Turning to the daily, we can see how price put in a lower-high below $3500 and then broke daily bullish structure with that lower-low into $3120, with momentum now more choppy. We have pushed off that support level but remain below a confluence of key resistances, where I think it is more likely we make another lower high with momentum following suit. It is after this that I think we see that deeper pullback in Gold, at least into $2950 but potentially as low as the 200dMA at $2800 over the coming months, before basing and then re-accumulating for the next leg higher in this longer-term bull market. Invalidation on this view short-term would be a breakout above that local trendline resistance and then a higher-high above $3440, turning daily structure bullish once again, particularly if this is accompanied by a shift in momentum to the upside also. In that scenario we likely trade into $3700 before a more meaningful mid-term top formation.
DXY:
Price: 99.3
Weekly:
Beginning with the weekly for the Dollar Index, we can see that price bounced off support at 96.8, pushing into 101.5, marginally shy of the 200wMA, before rejecting last week and turning lower this week back below the 100 handle. I think at this point we are in that Q3/Q4 2017 phase of the Dollar cycle, where we formed a weekly low followed by a lower high and then a final lower-low and consolidation range into January 2018. If the Trump dollar dynamics continue to rhyme, we should see 96 hold and lead to a more meaningful rally over the coming weeks into 102.5ish perhaps, followed by the final leg lower, where we could trade that 93-94.5 range before marking out a cyclical bottom in the longer-term dollar bull trend. We may already have that lower-high in at 101.5 but that becomes more probable if we close the weekly below 99 here, in my view, where the more accelerated moves of this cycles persist and we get that next leg lower over the next couple of months.
Daily:
Looking at the daily, we can see how price found support at that 2023 low around 99 when I marked out the likely trajectory, pushing higher from there through the 2024 open into the 61.8% fib retracement of the swing lower from 104.3. This is where price marked out the local top and has since traded all the way back into 99.3, with momentum poking above 50 on daily RSI but getting slapped back down. This may well be that lower-high all done and dusted, in which case we should see 99 flipped into resistance going into early June and fresh lows follow below 97 from there. If we are to see a more sustained reversal from the dollar here into a trendline retest from the yearly highs, we need to see 99 act as support here. Big couple of weeks ahead for DXY...
SPX:
Price: $5900
Weekly:
Beginning with SPX on the weekly timeframe, even I was caught out by the speed of the recovery here in US equities despite my bullishness, with SPX pushing all the way into $5977 as of this week, very much resemblant of that Covid recovery. We only have one major level of resistance remaining below all-time highs and that's $6090, above which we trade $6150 and price discovery beyond that. I think anyone still doing mental gymnastics over the strength of this rally and expecting new lows below $4800 over the coming months is going to be sorely disappointed. I struggle to recall a recent recovery that has felt more hated in US equities. That being said, I do expect some consolidation and a pullback going into early June, but much like buying early April weakness and early May weakness has been rewarded, I expect buying early June weakness to be rewarded as price continues higher into Q3.
Daily:
Finally, dropping into the daily, bears might get something to cheer about if we push into the 6xxx area and then form some bearish divergence into the monthly close, where I would then expect a week or two of downside, potentially as low as the Q2 open at $5607 to fill the more recent gap before continuation higher into new all-time highs. There is zero reason to be bearish on a mid-term timeframe unless we lose $5500 - above that we are much more likely to see a choppy grind higher that continues to confound and irritate many. Daily structure is bullish and there remains no trend exhaustion as of yet, but we are trading right around that 2025 open, so if ever we were to get a more meaningful pullback it would be from here. I told people explicitly not to get bearholed back in April and I have to say even my best expectations were surpassed as relates to the sharpness of the recovery. $6600 in 2025.
I hope you've found some value in the read this week!
And if you've not already signed up for Ostium, please do so and test out some of the recent updates, including:
On-chain leverage for indices including NDX, SPX, FTSE & more...
Unified accounts and gas-free trading
Imminent listing of single-stock perpetuals, including TSLA, NVDA and META (but you didn't hear that from me...)


-2025-05-21_07_39_56.png)
-2025-05-21_07_38_04.png)