This blog references an opinion and is for entertainment and informational purposes only. It is not intended to be investment advice. Seek a duly licensed professional for investment advice.
In this 43rd Market Outlook here at Ostium Research, we'll be taking a look at the week ahead in markets, focusing specifically on price-action, positioning and event risk for Bitcoin, Ethereum, Gold, SPX and Crude Oil.
Firstly, let's take a look at the calendar, where we have a quiet start but a busy end to the week ahead:
TUESDAY: ECB BANK LENDING SURVEY
THURSDAY: ECB INTEREST RATE DECISION: (CONSENSUS 2.15% VS PREVIOUS 2.15%)
THURSDAY: US INITIAL JOBLESS CLAIMS: (CONSENSUS 230K VS PREVIOUS 221K)
THURSDAY: US S&P GLOBAL MANUFACTURING PMI (JUL): (CONSENSUS N/A VS PREVIOUS 52)
THURSDAY: US S&P GLOBAL SERVICES PMI (JUL): (CONSENSUS N/A VS PREVIOUS 52.9)
FRIDAY: US DURABLE GOODS ORDERS (JUN): (CONSENSUS -11% VS PREVIOUS 16.4%)
Now, let's dig into asset-specific price-action for the week ahead, looking firstly at Bitcoin:
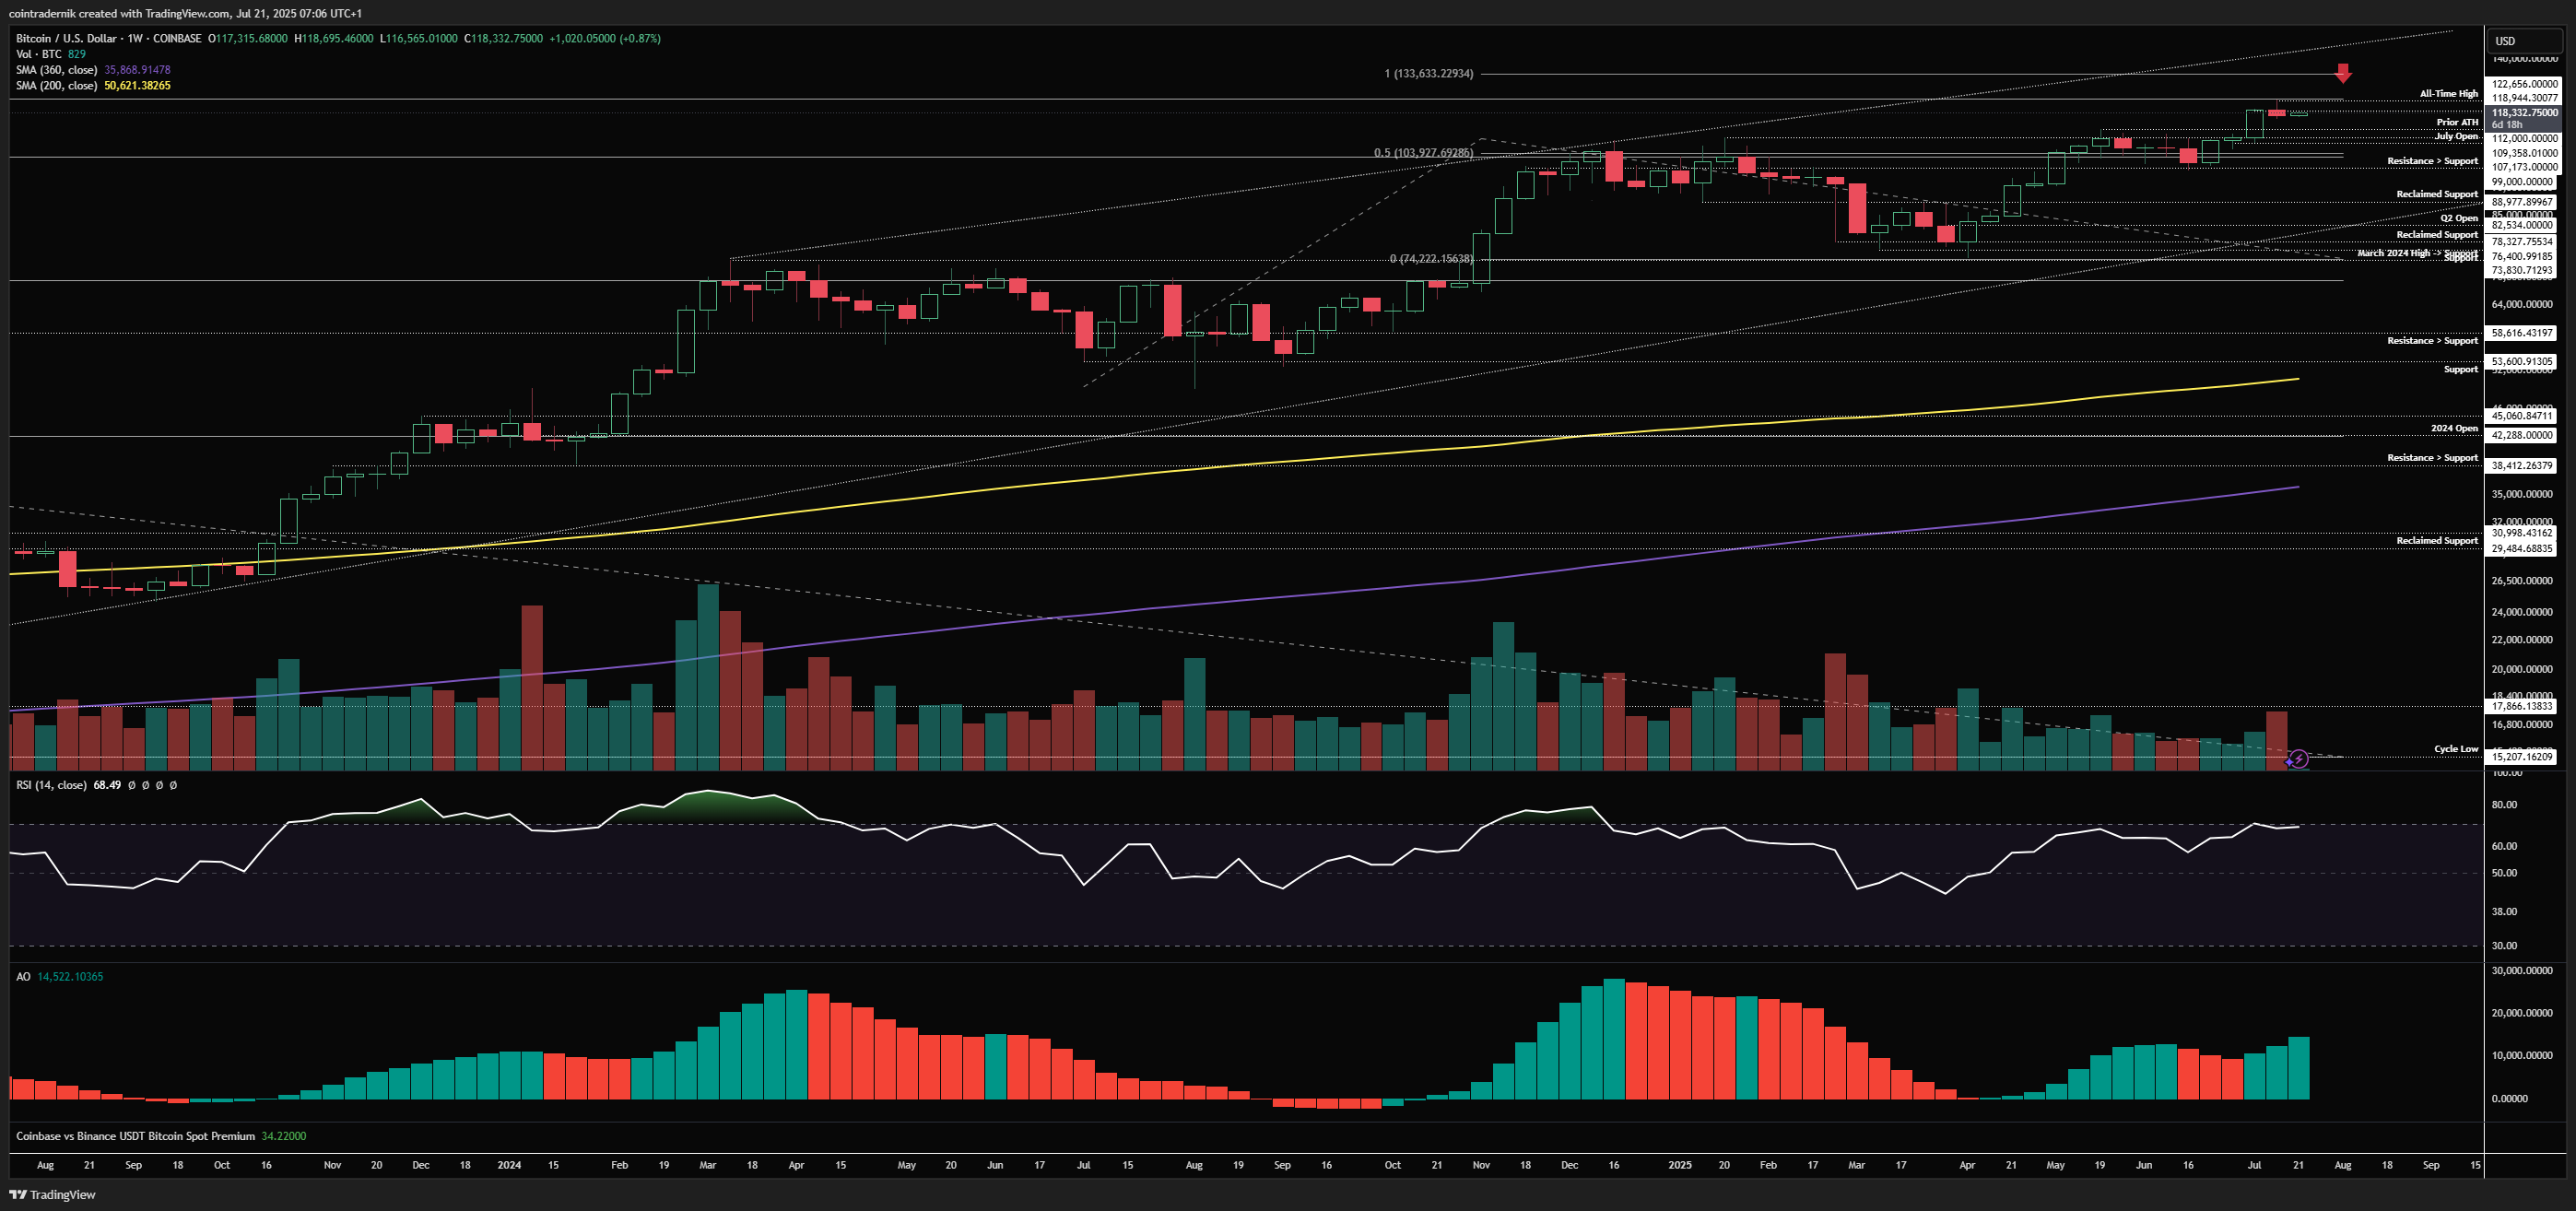
Bitcoin:
Price: $118,332
Weekly:
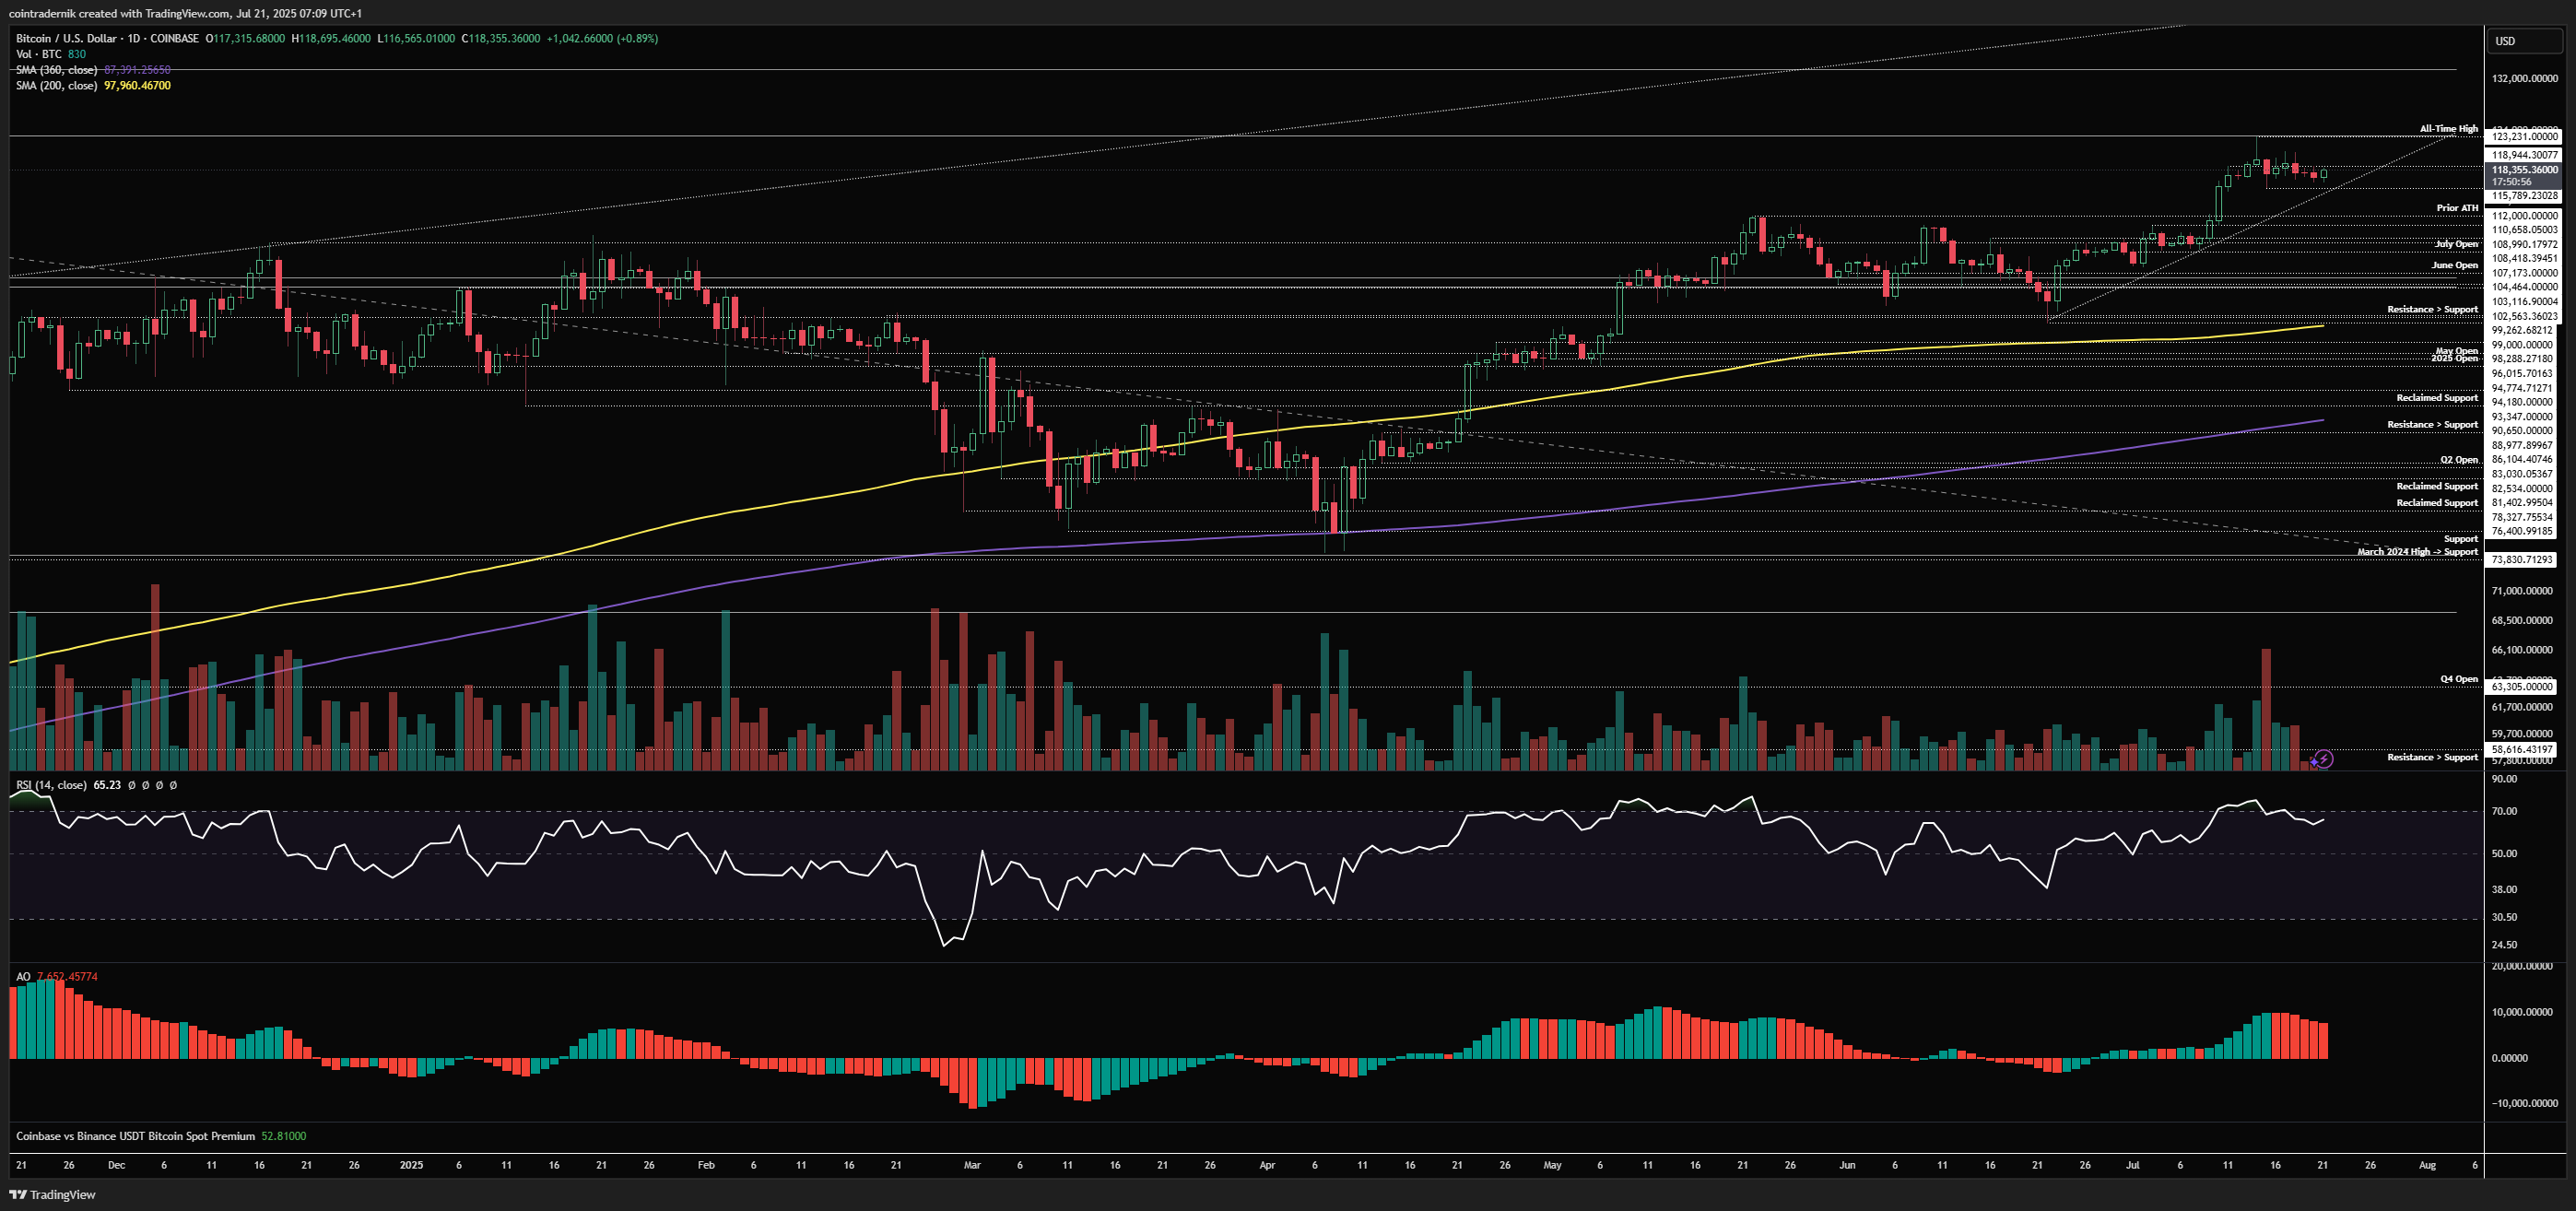
If we begin by looking at the weekly for BTC/USD, we can see that last week saw price push into fresh all-time highs around $123k, where we rejected and sold off, closing the week back near $117.3k, marginally below the previous weekly close. Momentum on this timeframe is still very much supportive of continuation higher but if we close below $117.3k this week, we have a swing-high formation that could lead to a pull-back during an historically weak August period. If we close this week back above $119k (the previous weekly close), I would expect that early shorts anticipating a local top are trapped and provide fuel for a further squeeze towards $133k. Nonetheless, structure is very much bullish so if we do see signs this week that an August pull-back or consolidation period is likely, this should be viewed as an opportunity to look for fresh longs for the next leg higher. Only if we accept back below $110k as reclaimed resistance does this look more bearish.
Daily:
Looking at the daily, we can see that price remains for now above local trendline support and has been sideways since pushing into $119k, with that spike above the level into $123.2k being rejected and leading to further chop. We remain above local support at $115.7k for now, and I would not be surprised to see that level and trendline support get swept to bait more shorts before reversing, with a view towards at least another test of $123k in July. Closing below $115.7k and trendline support would suggest a deeper pullback is underway, where $112k becomes the obvious level, though I expect this would either be front-run or spiked below in a larger liquidation event before a bottom formation. Daily momentum and structure still look promising here for further upside.
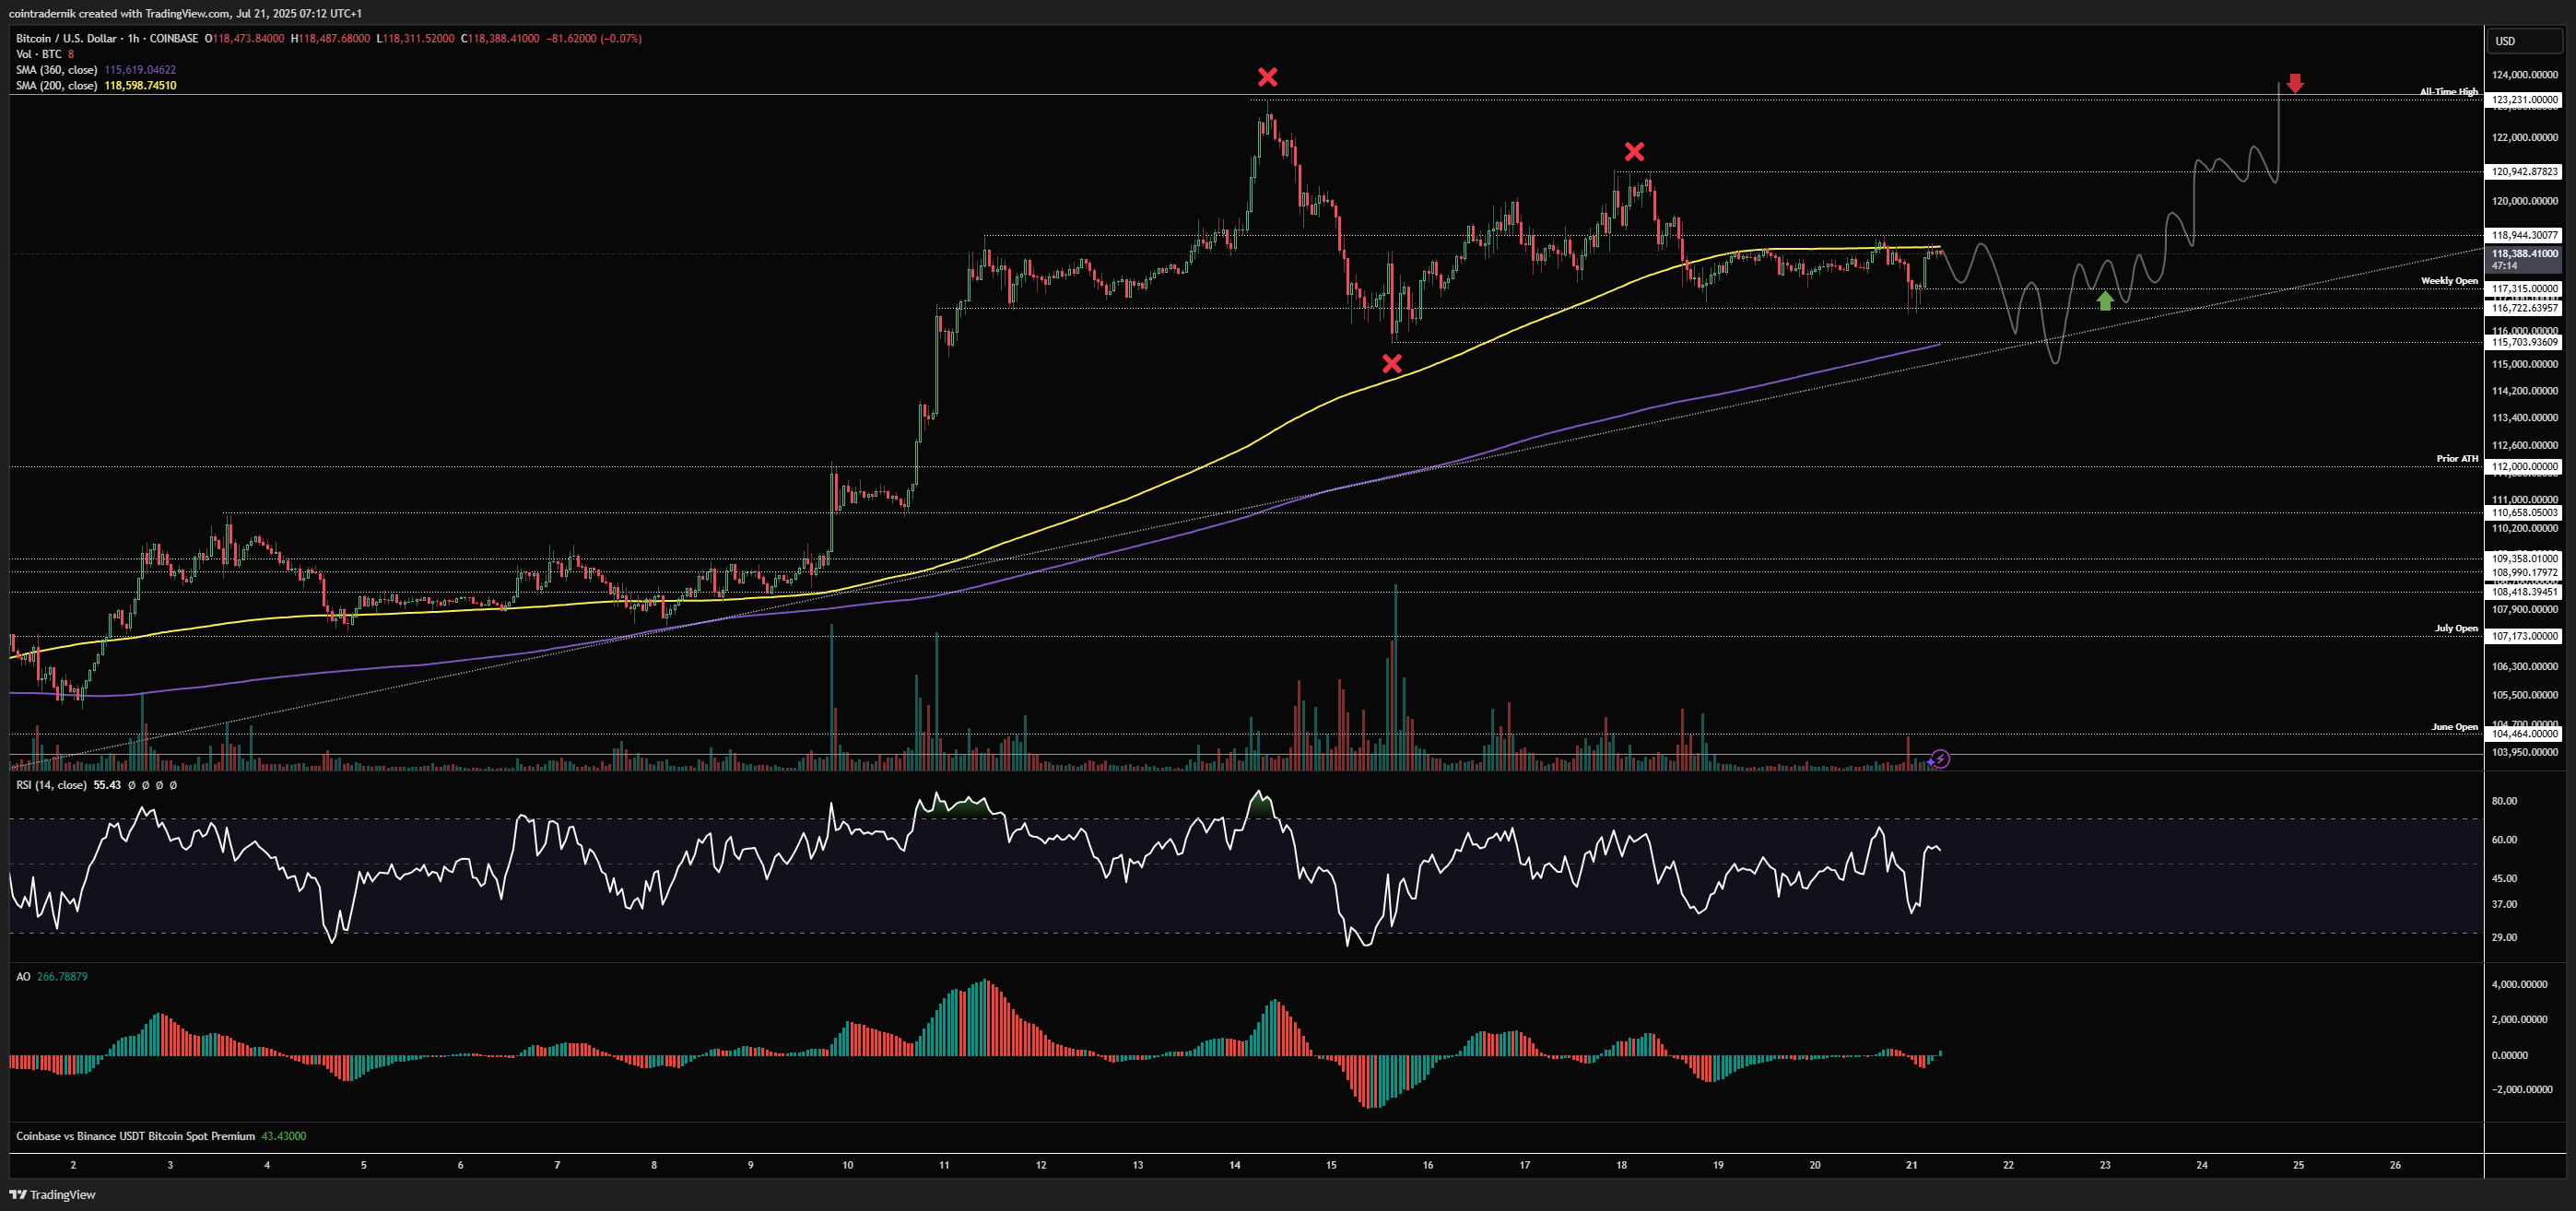
Looking at potential setups for the week, as mentioned above the ideal long setup would be to leave $121k unswept and break lower early this week, taking out $115.7k into the 360hMA and trendline support before reclaiming the weekly open at $117.3k as support and then taking out those highs:
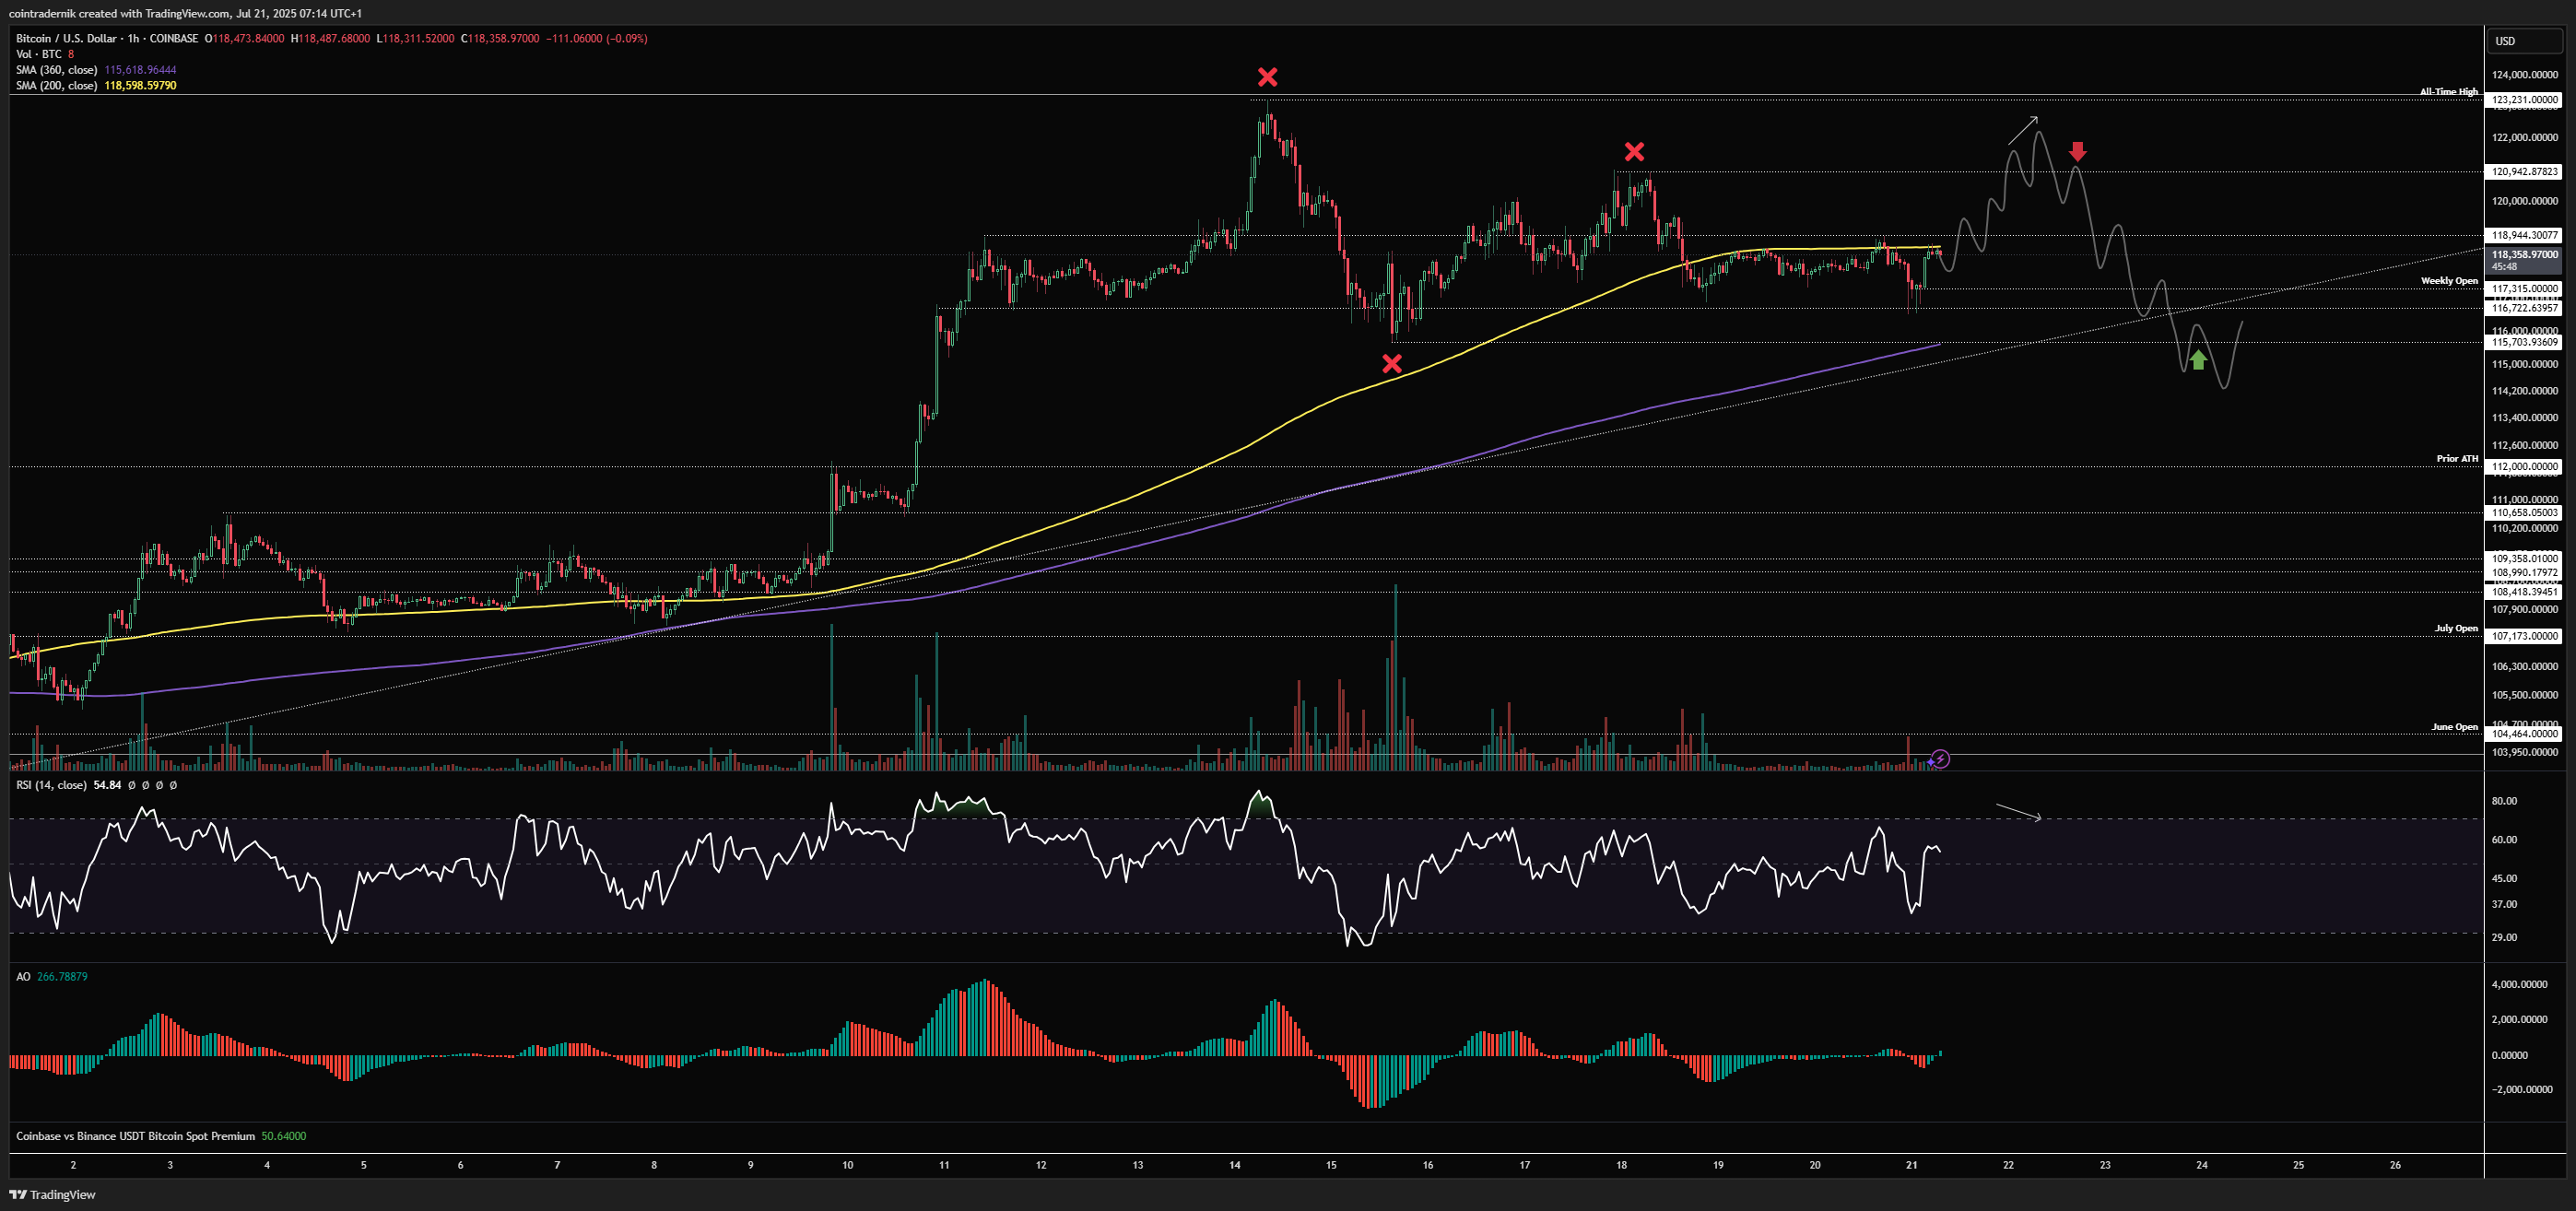
On the short side, if we drive higher today and tomorrow and then form bearish divergence above $121k and break back below it, you could look to fade that back into at least $115.7k:
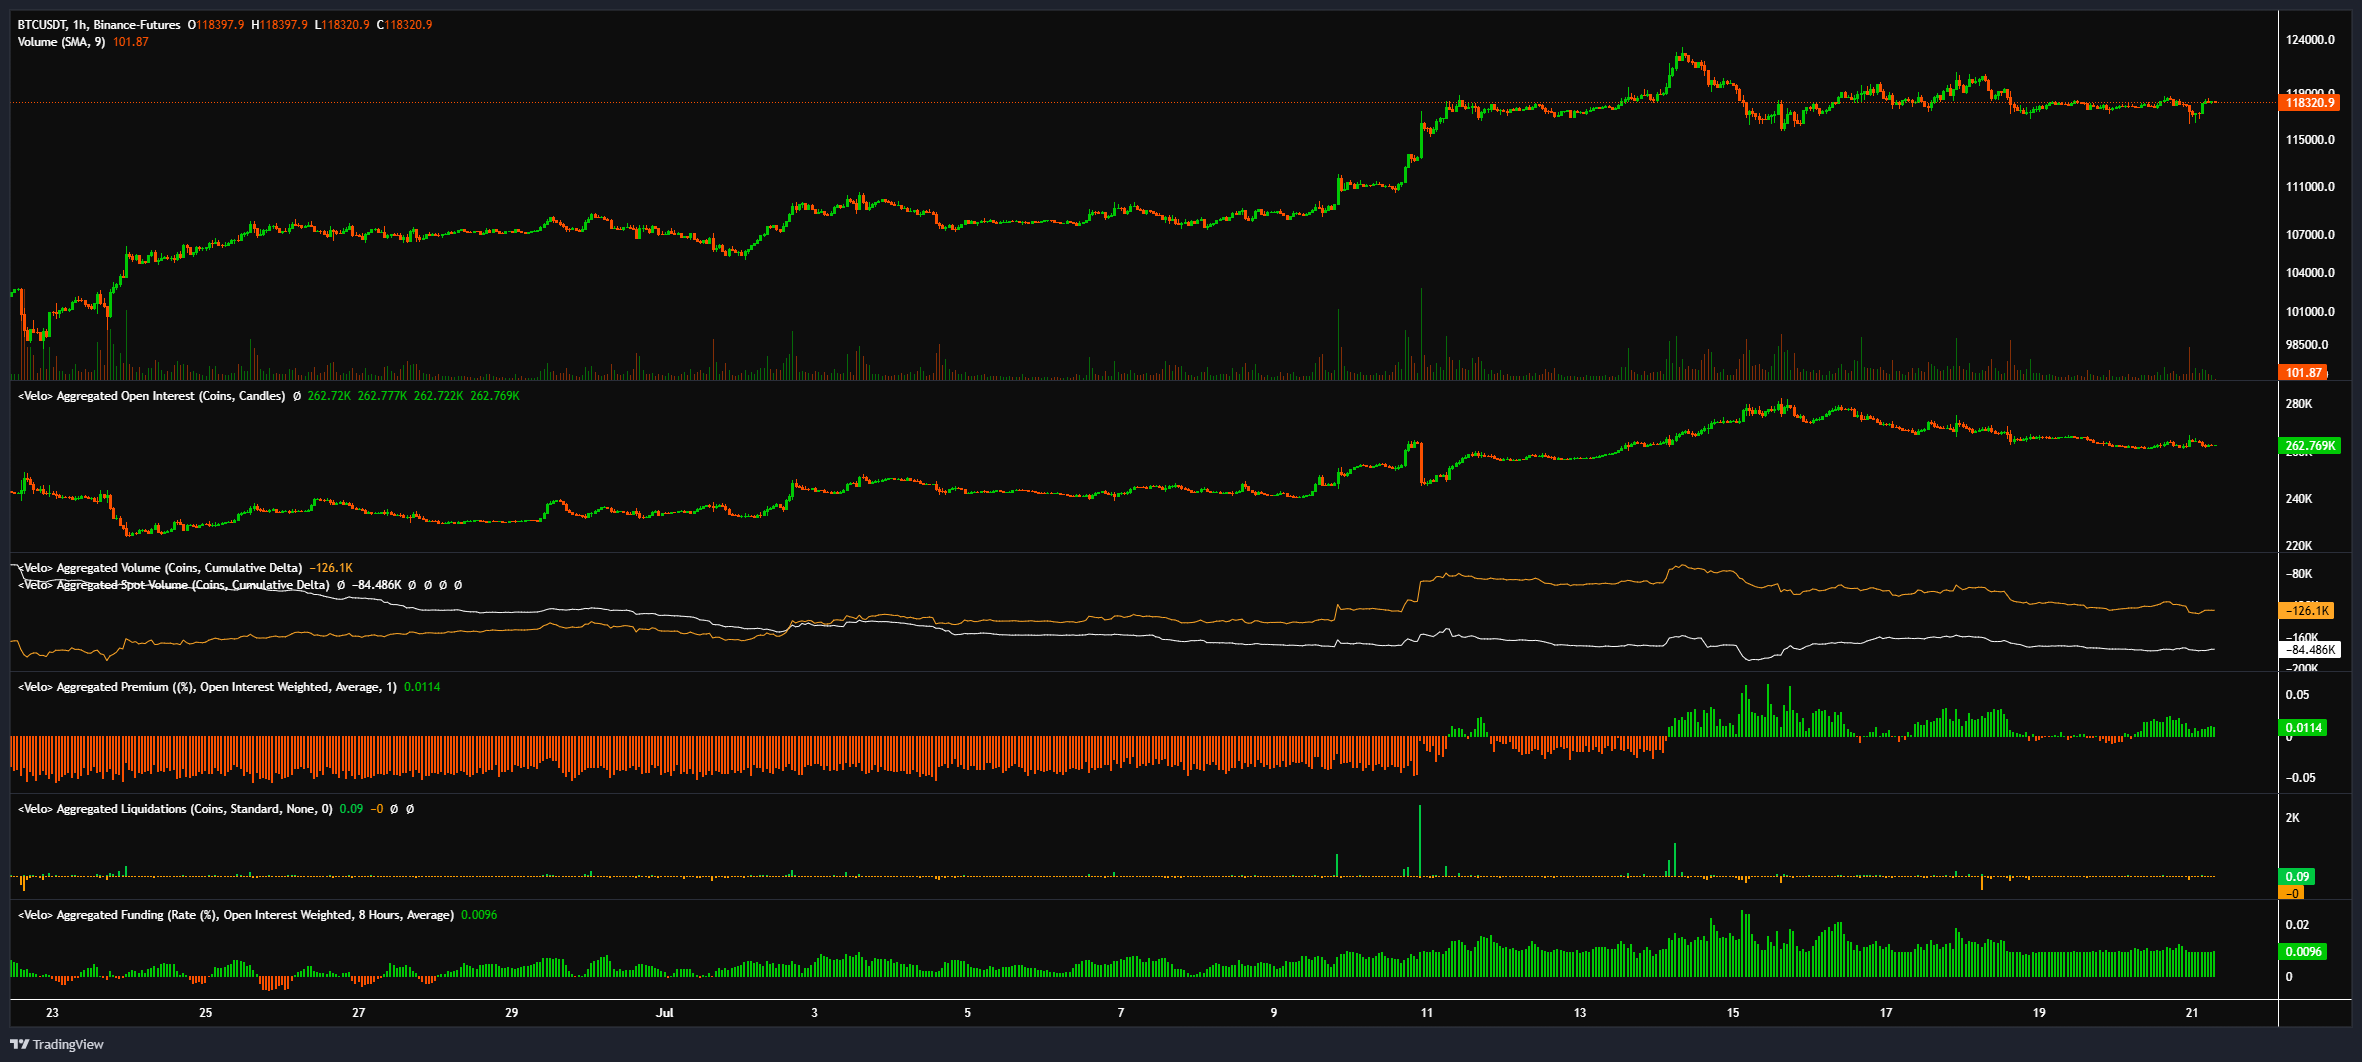
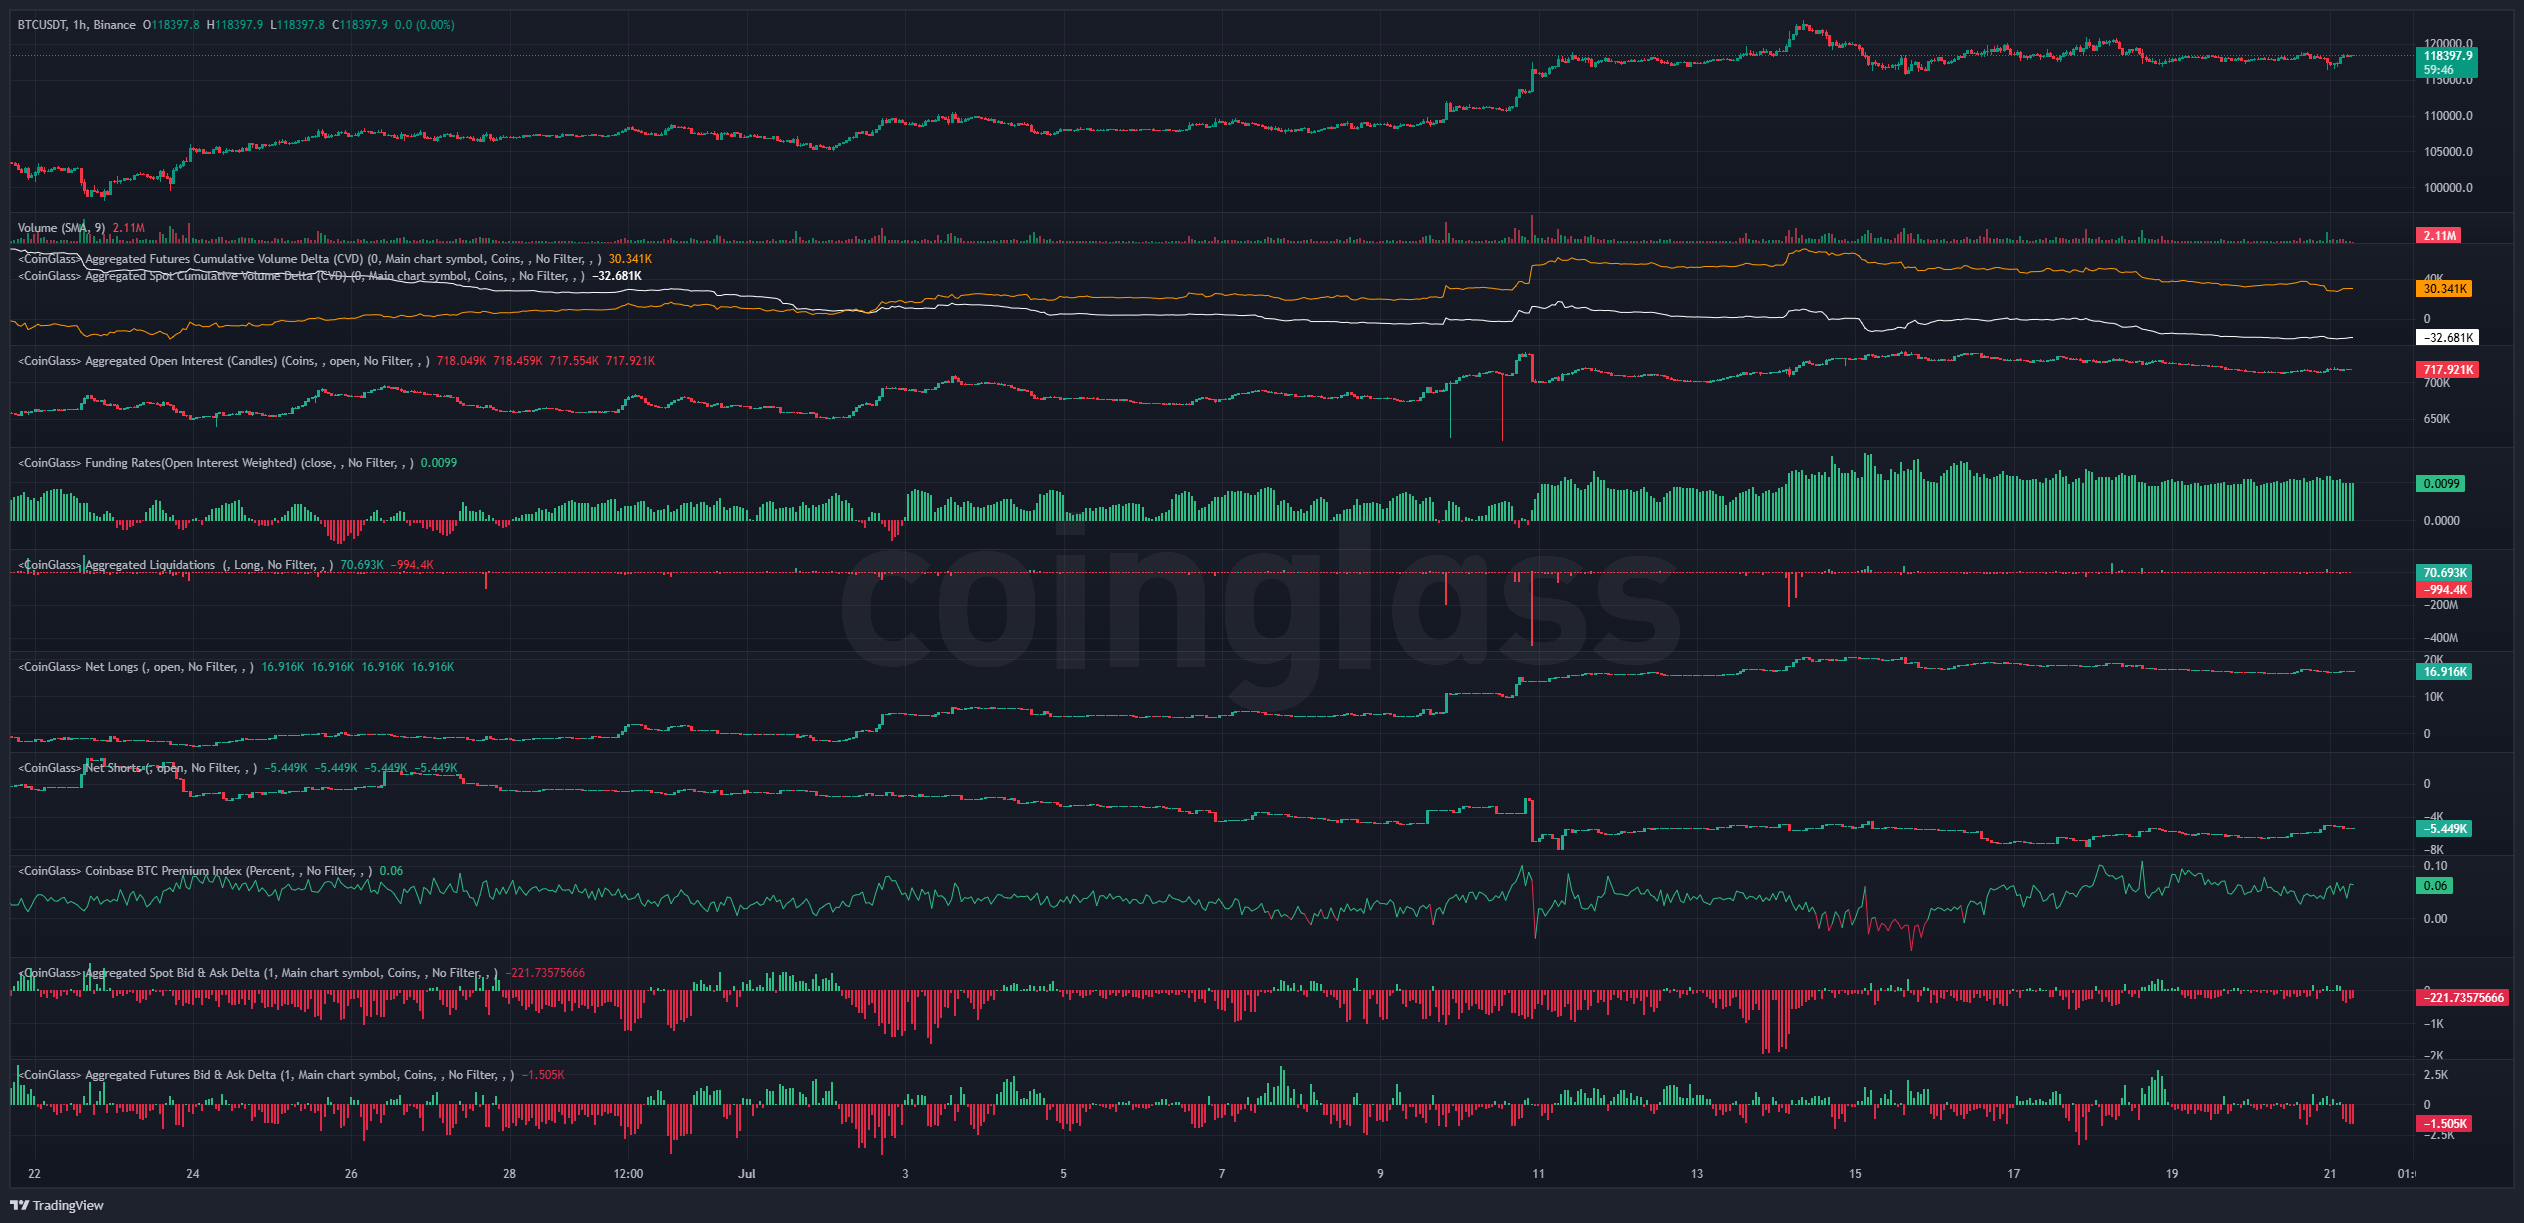
And here's a snapshot of positioning across Velo and CoinGlass:
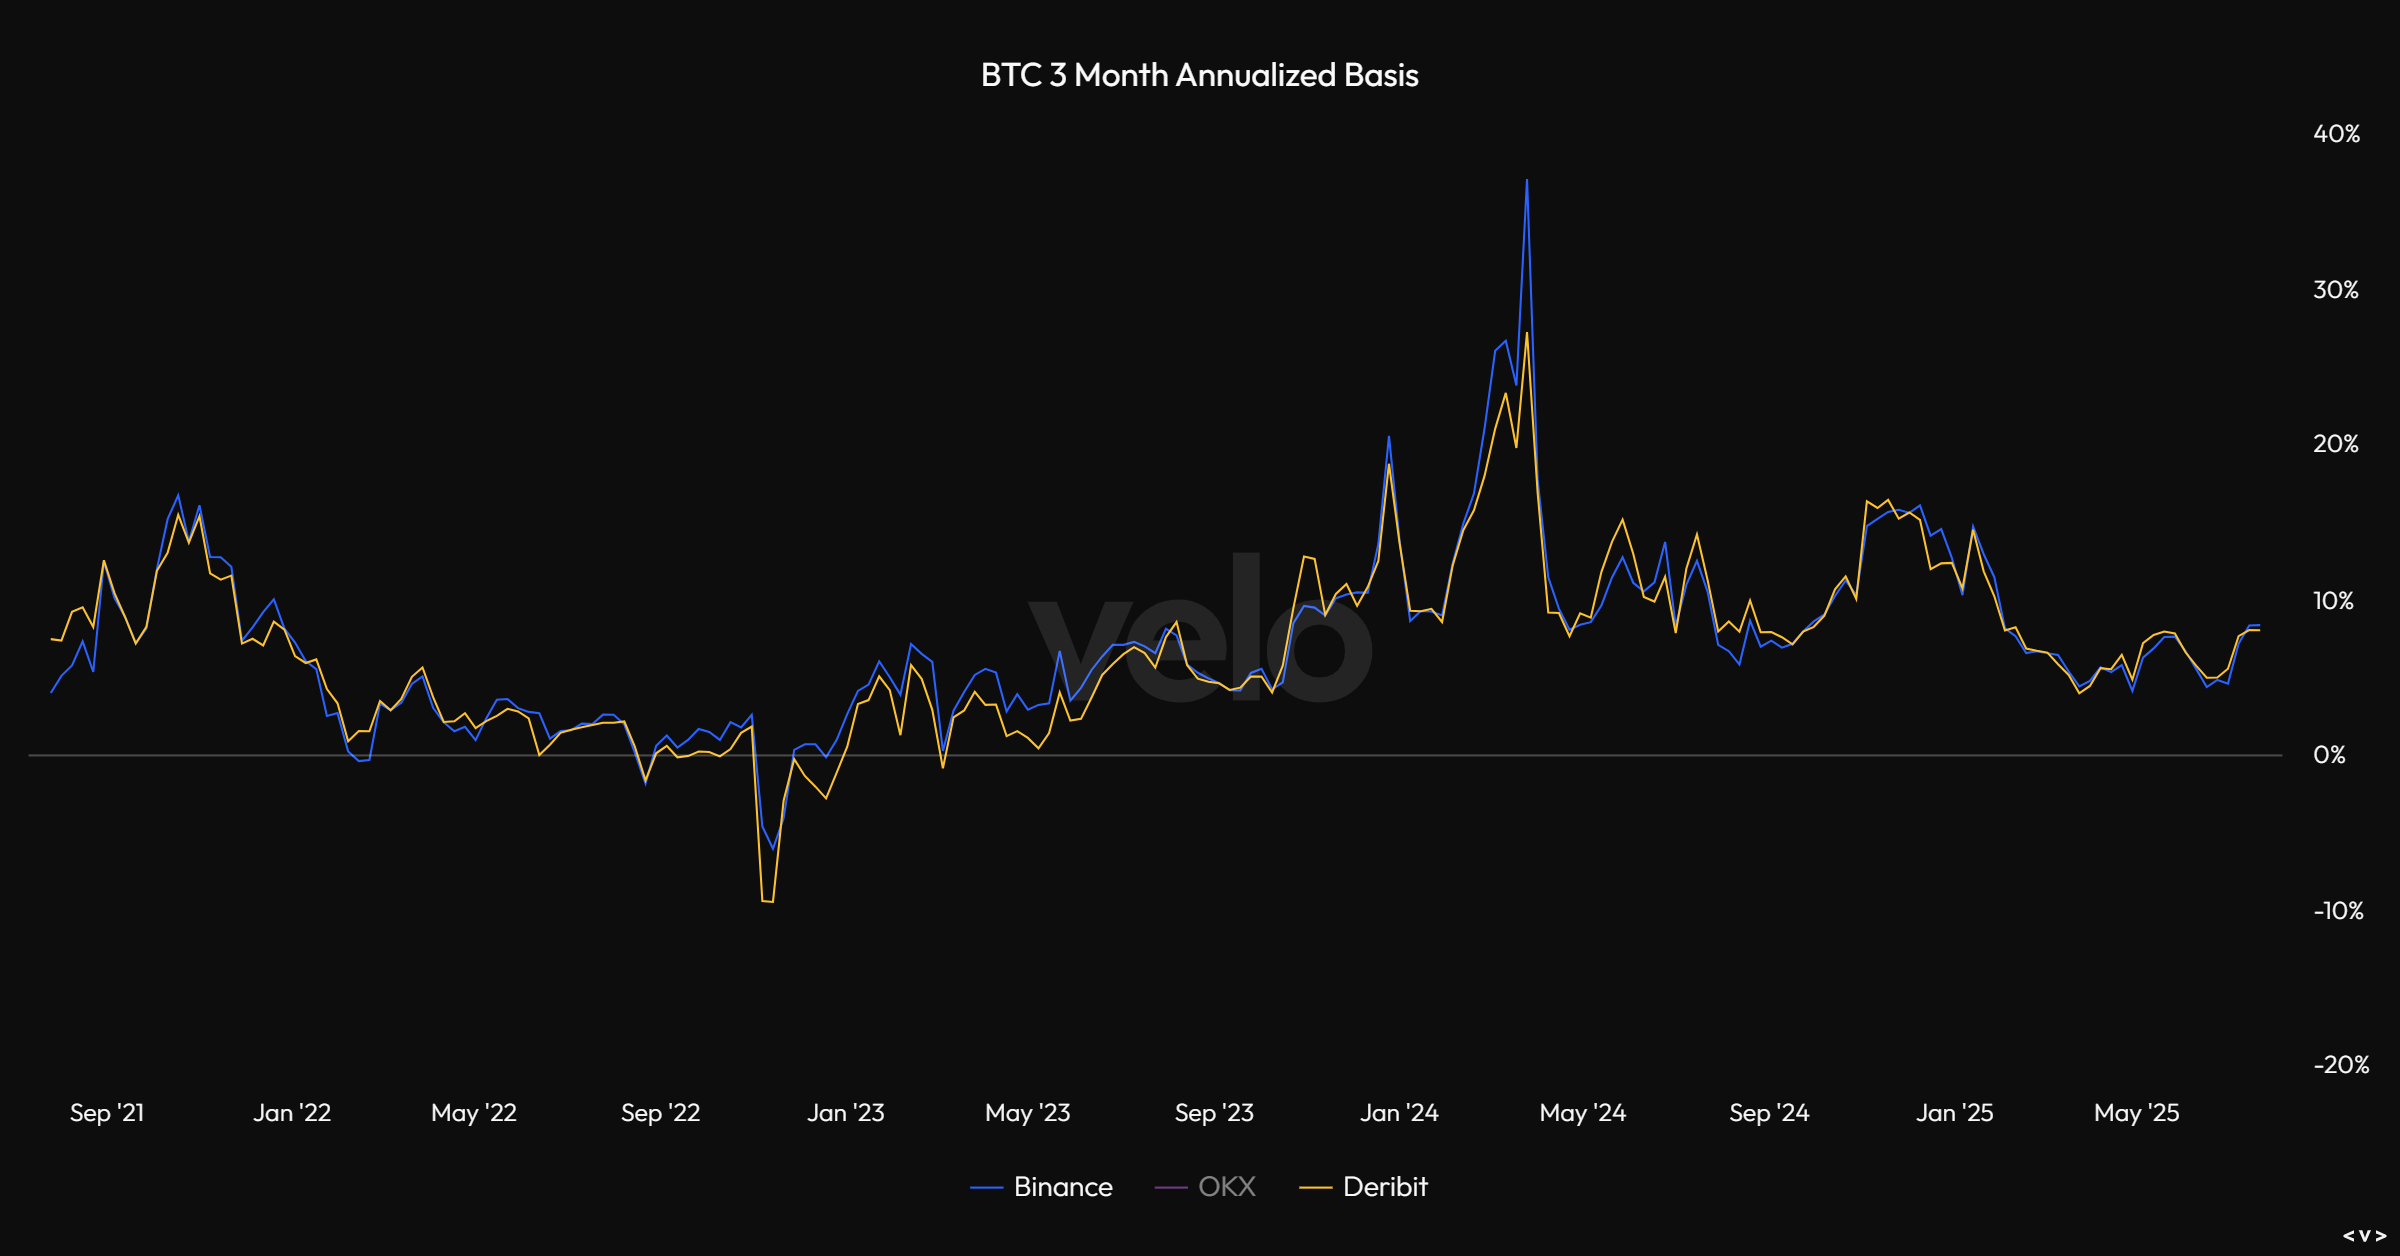
And here's 3-month annualized basis:
And Bitcoin OI vs Altcoin OI:
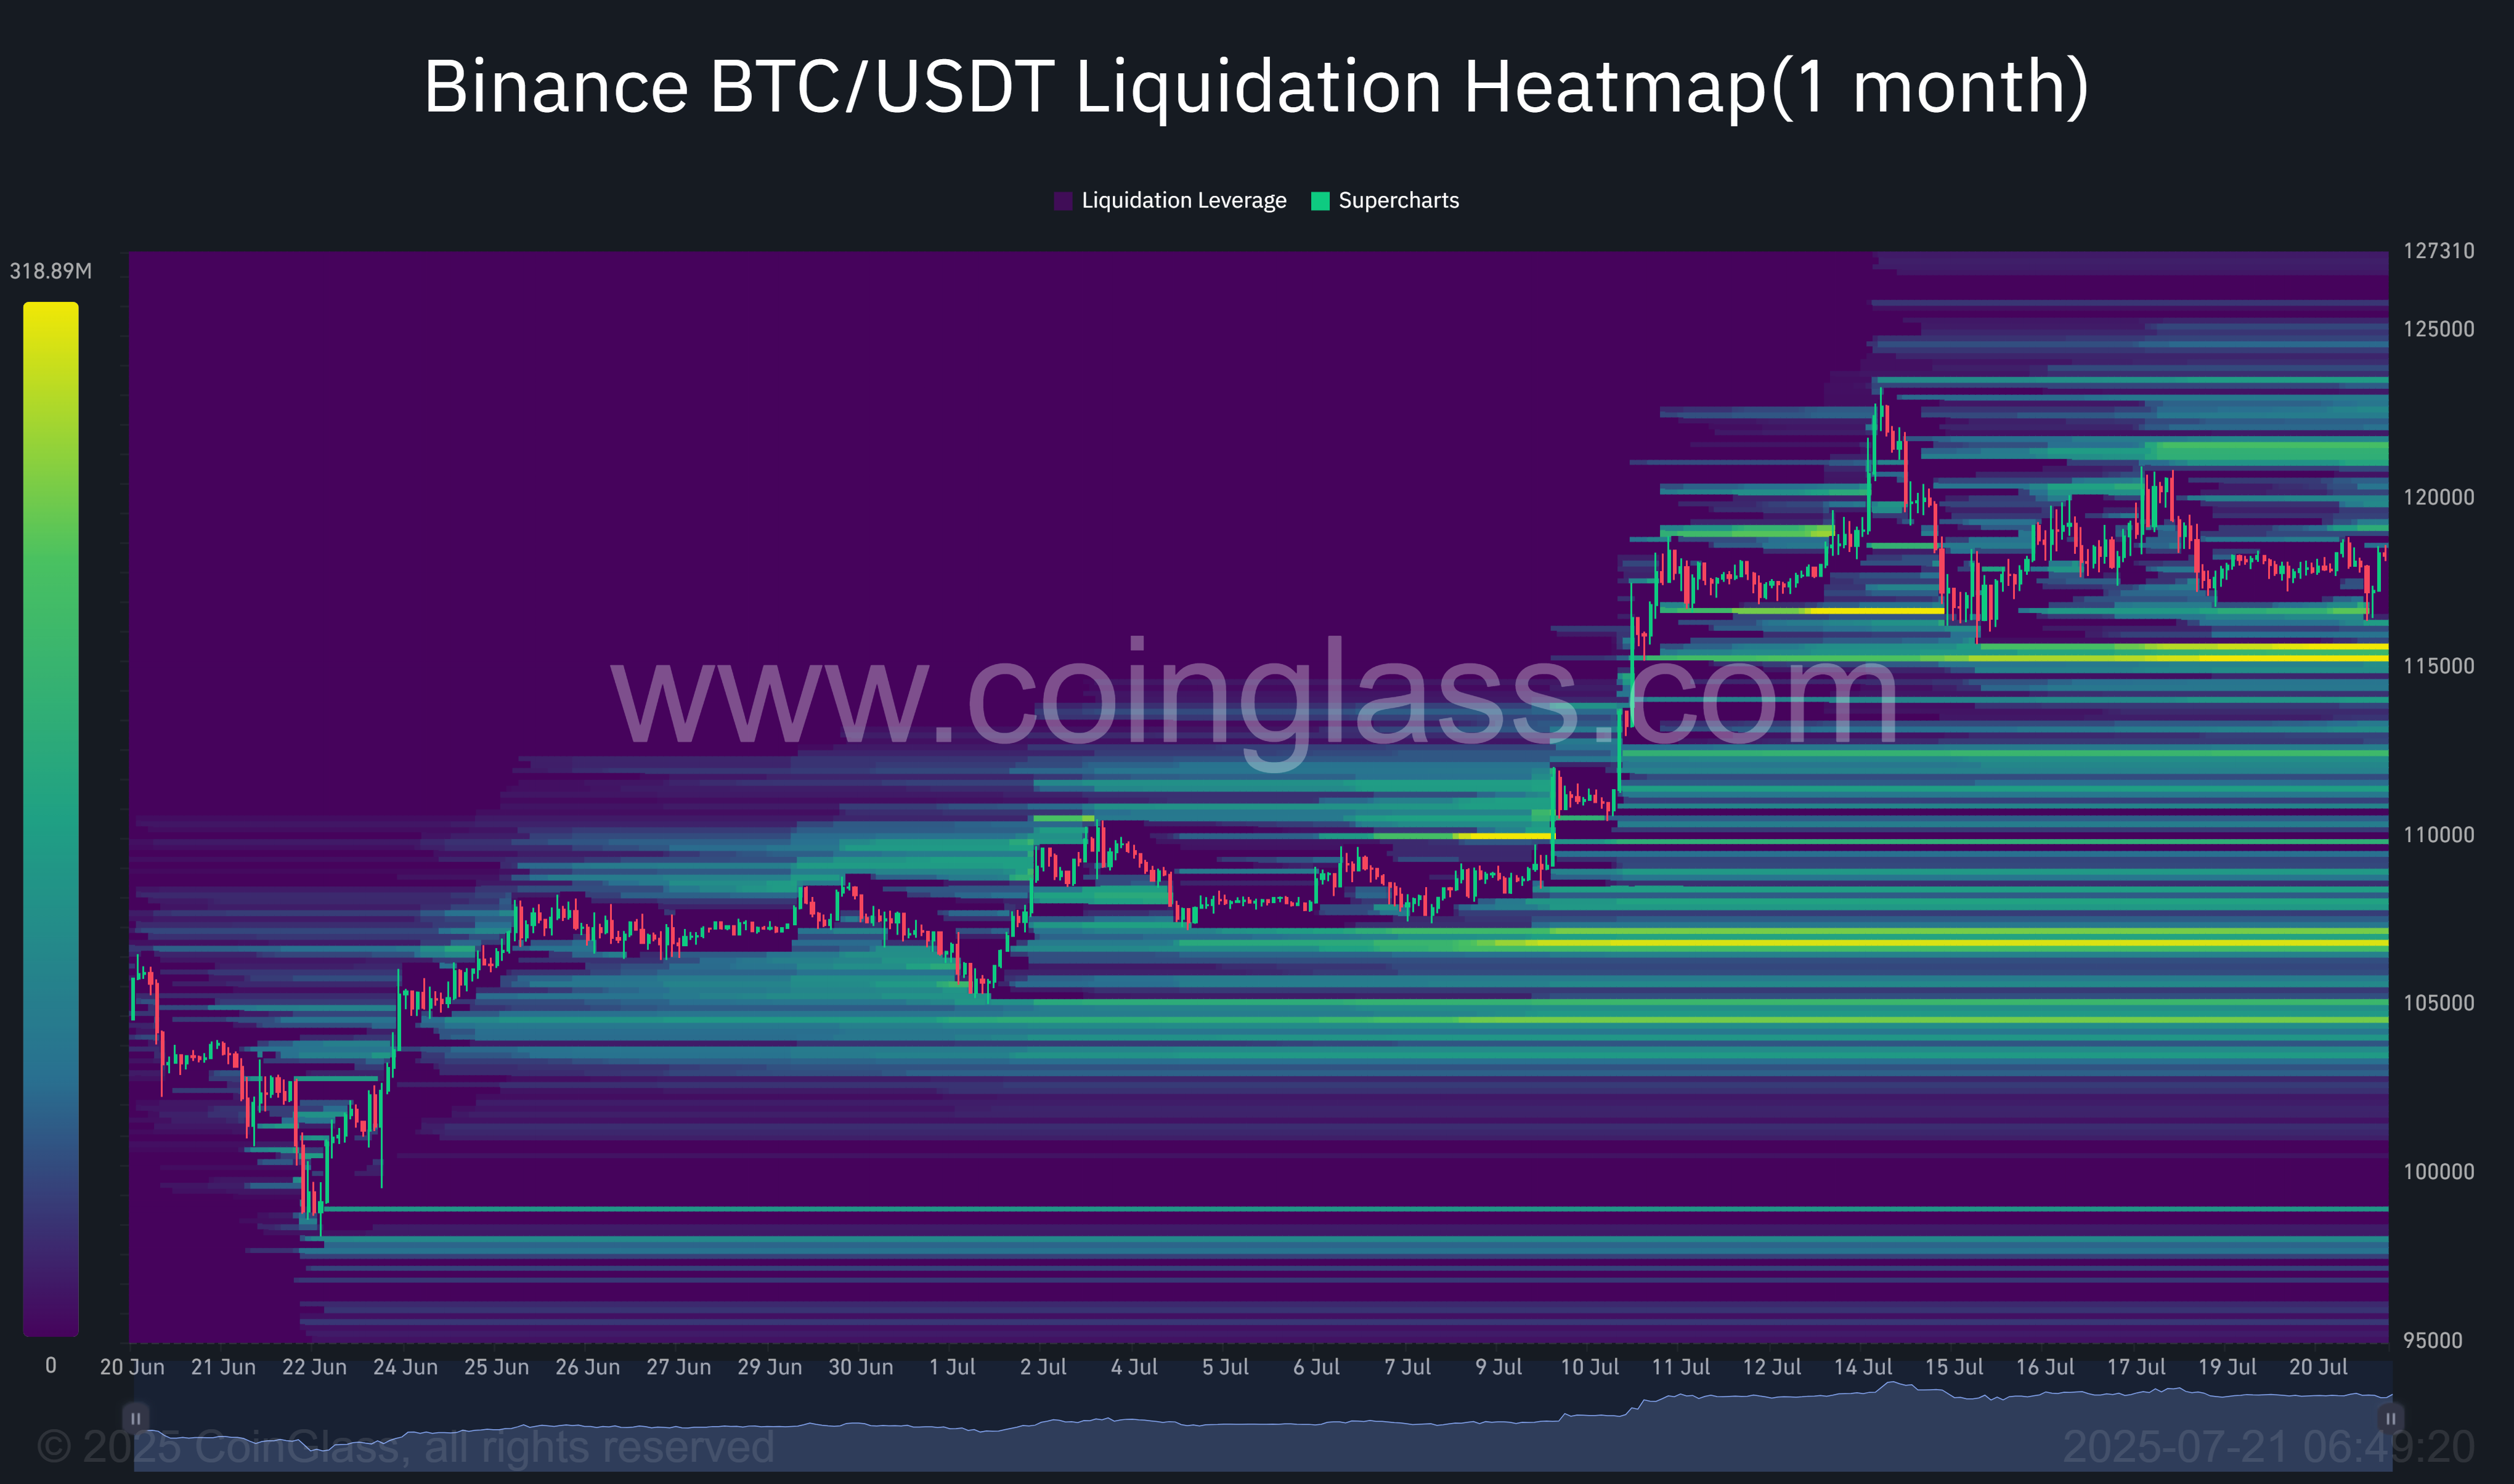
And finally some of the expected 1-week and 1-month liquidation levels:
Ethereum:
Price: $3792
ETH/USD
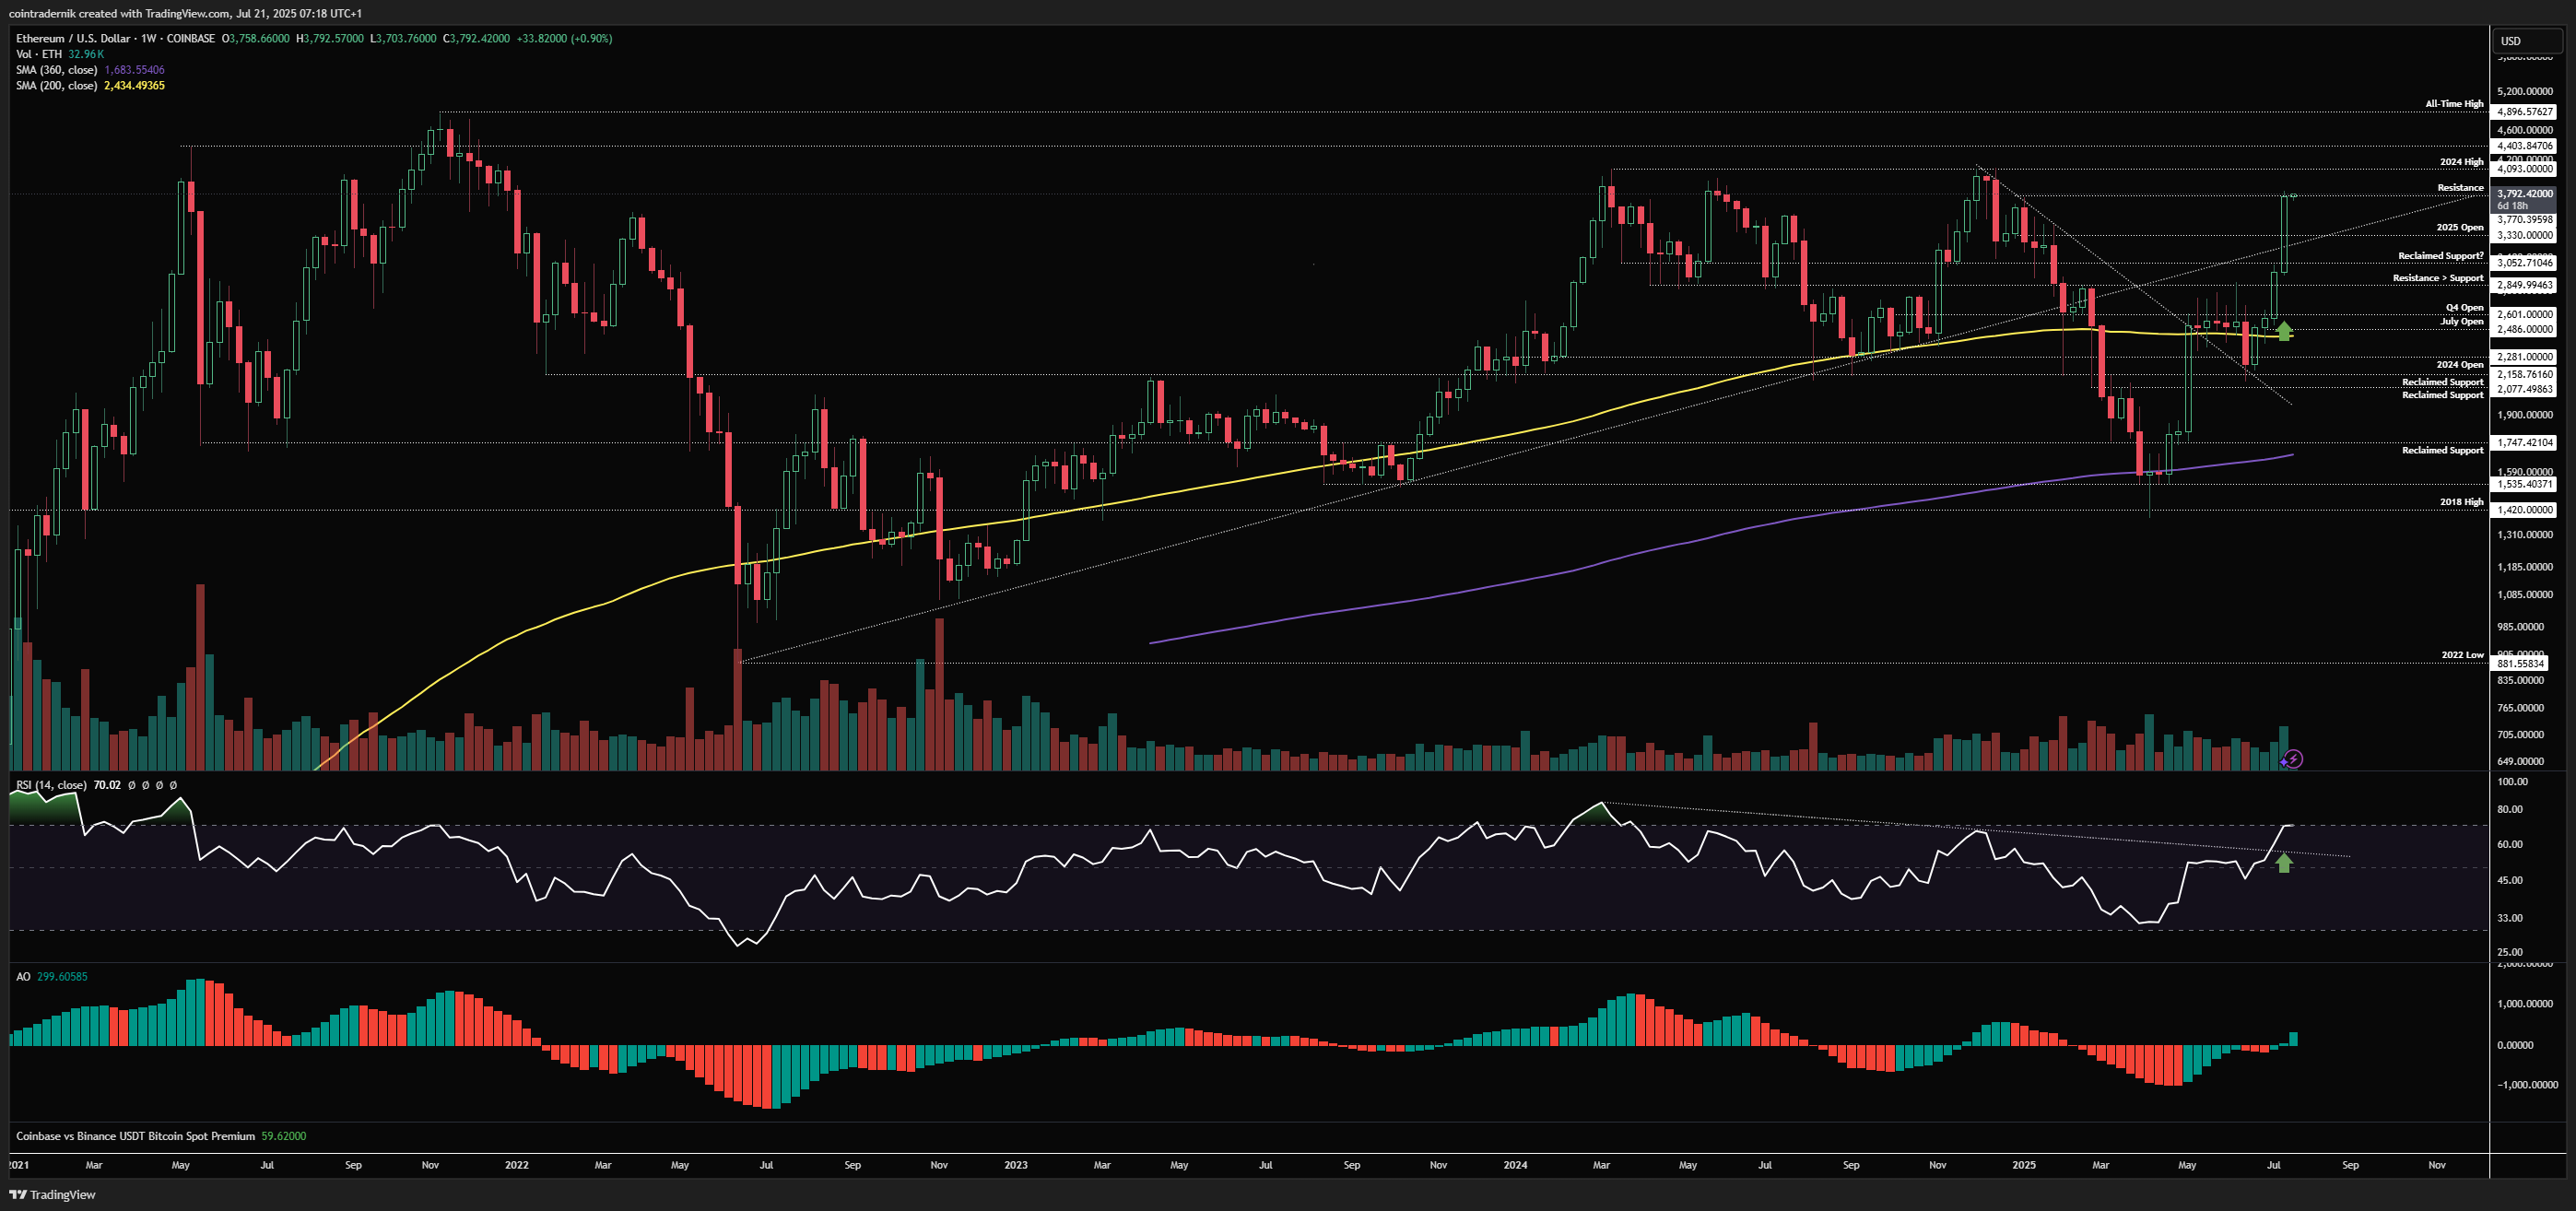
Weekly:
Beginning with the weekly for ETH/USD, I mean is there really much that needs to be said? We saw price rally off the weekly open last week having closed firmly through $2850 resistance and printed a weekly momentum breakout, leading to a monster move last week that push the pair back above trendline support from the bear market lows and through the 2025 open, continuing higher into the weekly close up near $3758. We have obliterated all of the major resistance below the 2024 highs in one weekly candle on growing volume after a momentum breakout, with $3800 the only minor resistance left before the $4100 retest. This will naturally be the most likely area for profit-taking given the multi-year resistance but I fully expect the level to give way in Q3 and lead to an all-time high retest at $4900. I would not be surprised to see some sort of pullback from $4xxx to $3330 (the yearly open) during a liquidation event assuming derivatives get suitably frothy over the coming weeks. This would be a huge buying opportunity for price discovery on ETH. A weekly close above $4100 is likely to lead to that all-time high retest swiftly, so that really is the key level we're looking at here going into August.
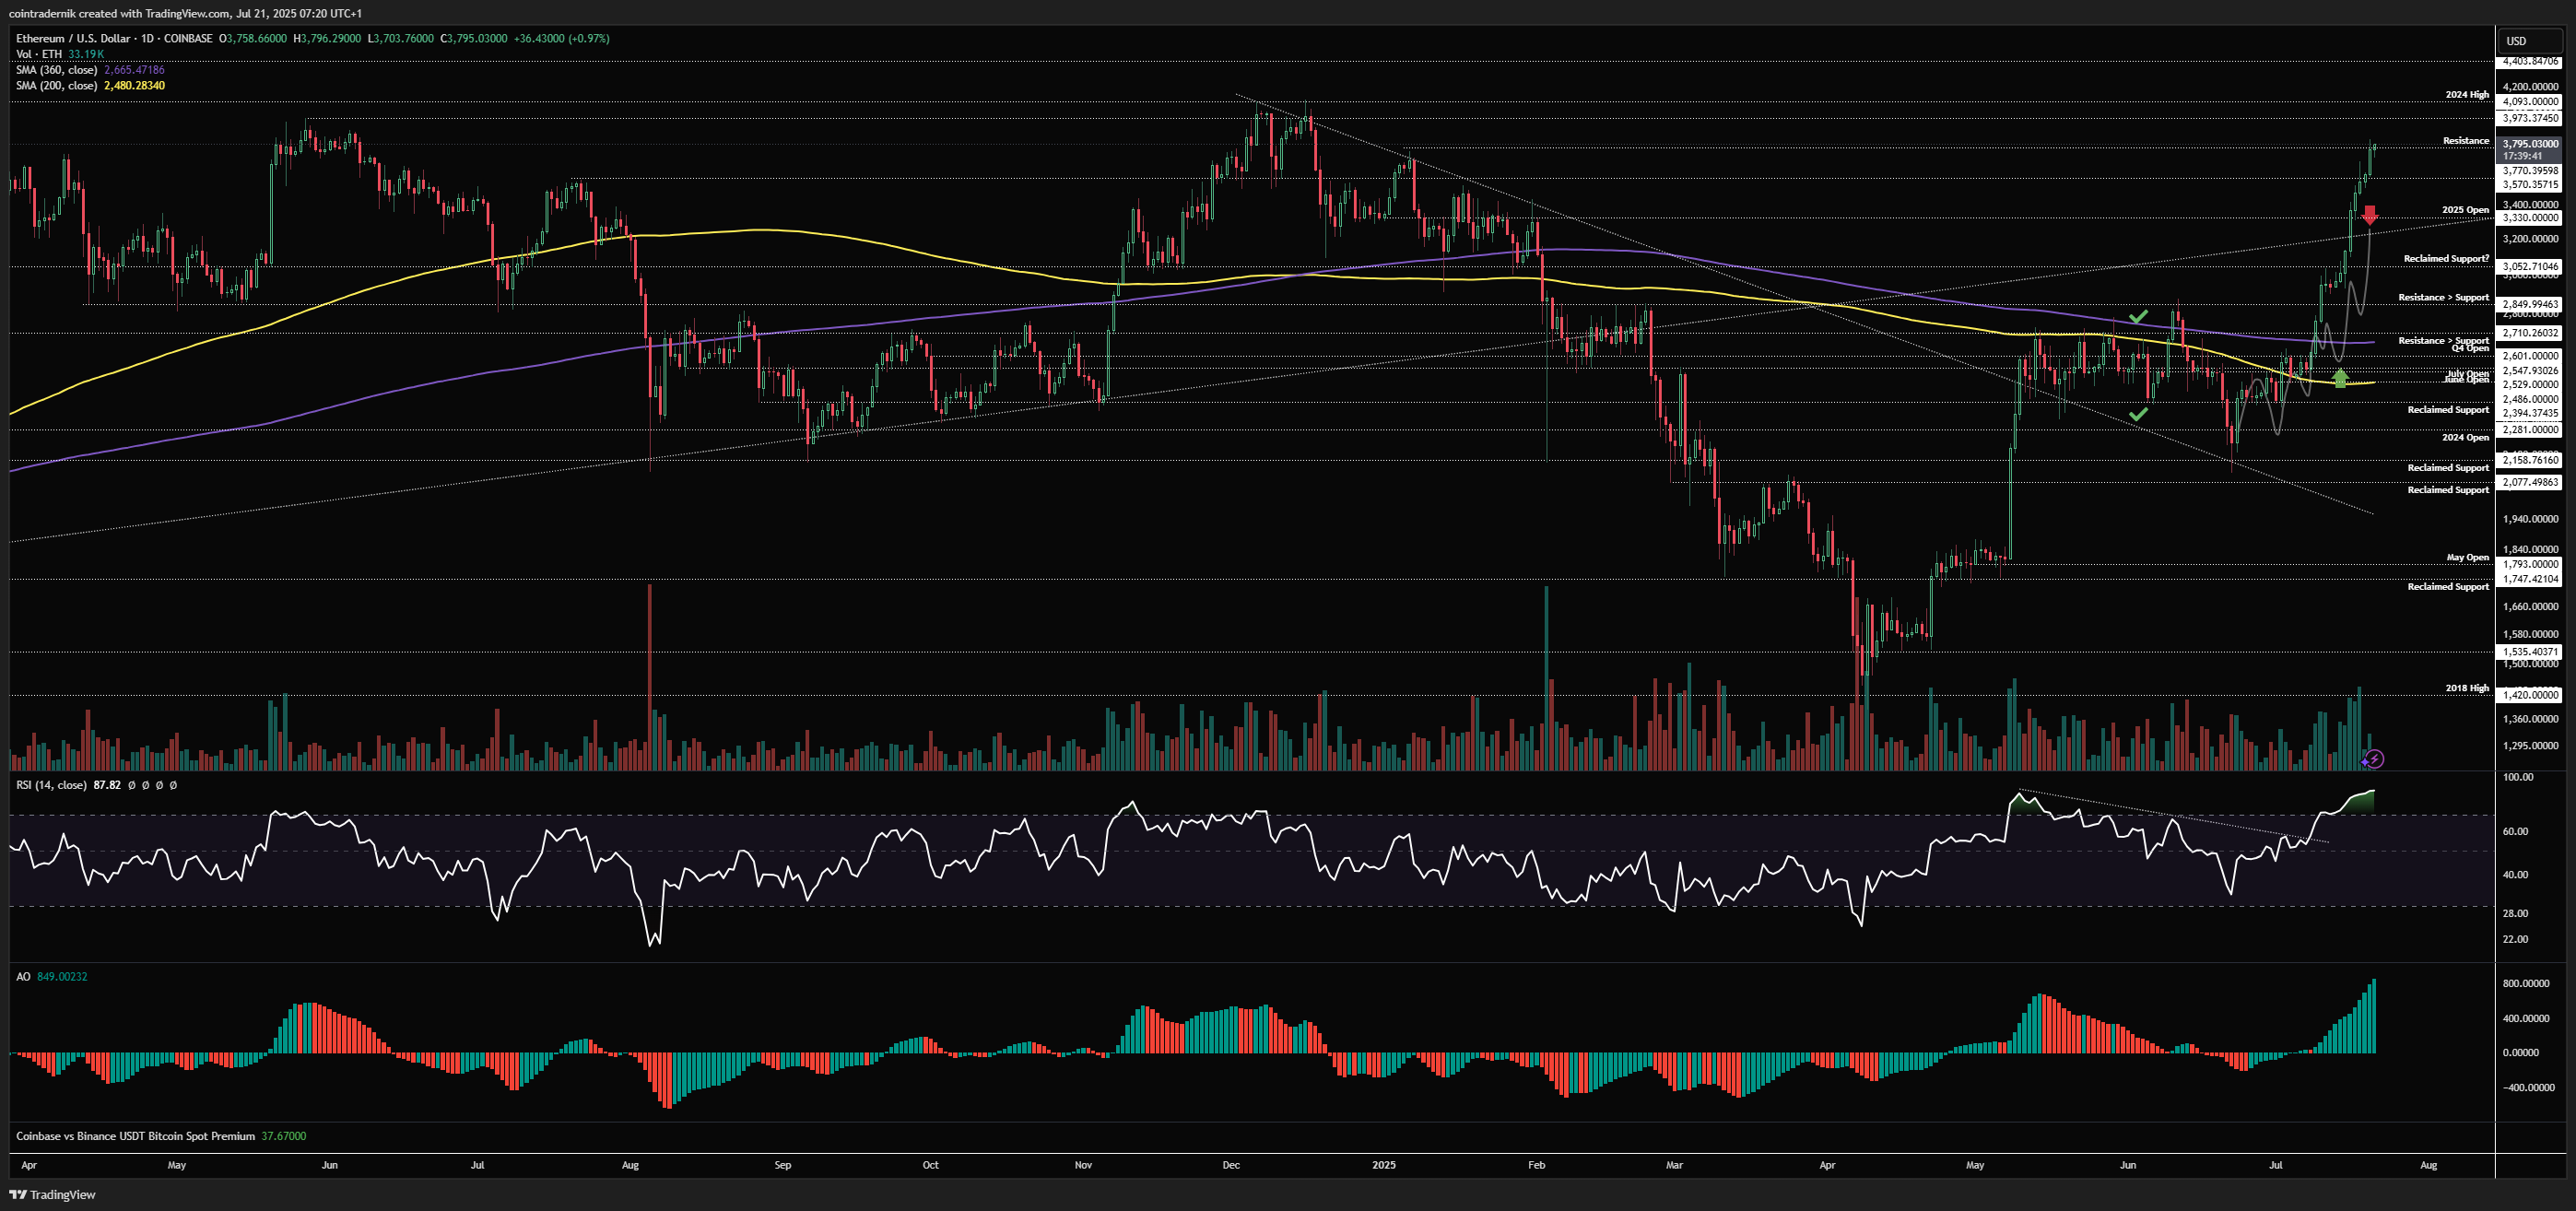
Daily:
Looking at the daily, even I did not expect the squiggly to play out quite so perfectly, with price finding no resistance in that cluster around the yearly open and instead blasting straight through it on growing momentum and volume. There is no exhaustion here yet on this timeframe, so there is every chance we rip higher again this week into $4093 before finding any meaningful resistance. As mentioned above, it's difficult to gauge where we might put in a local top or where the pullback will bottom out until we have a bit more structure, but if we do print bearish divergence into $4090 and then break down (and this corresponds with sentiment and positioning being stretched) we should see at least $3570 retested but potentially $3330 if we have enough leverage that needs washing out. Nonetheless, this is now very bullish momentum and structure on all timeframes and dips are buying opportunities for $5k+.
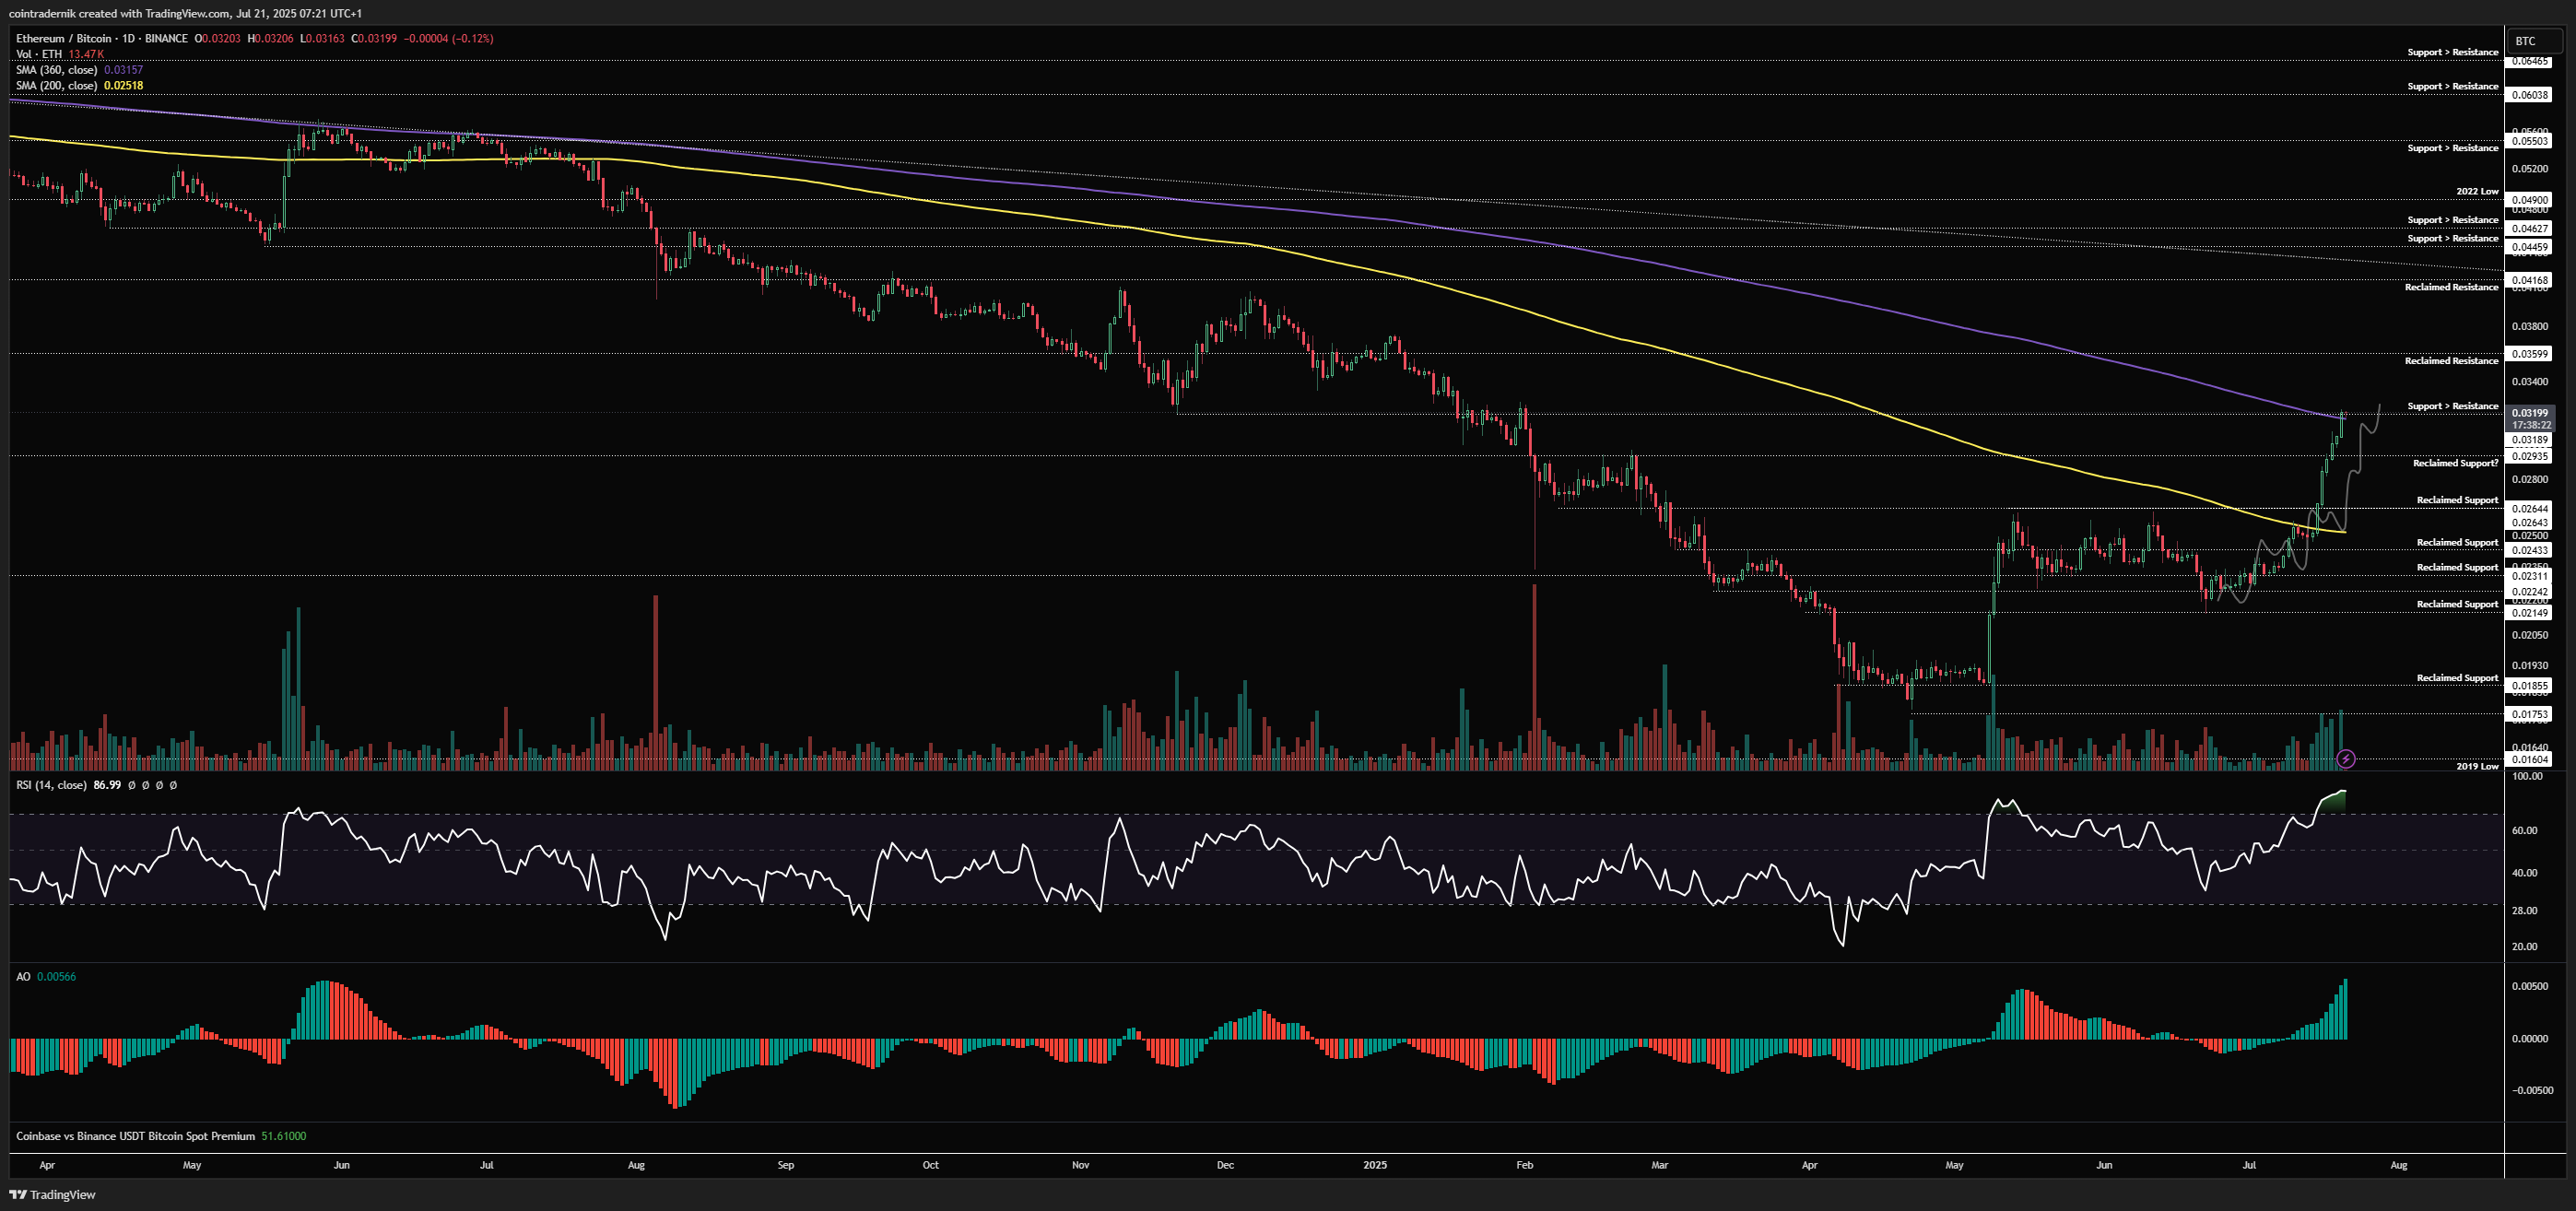
ETH/BTC
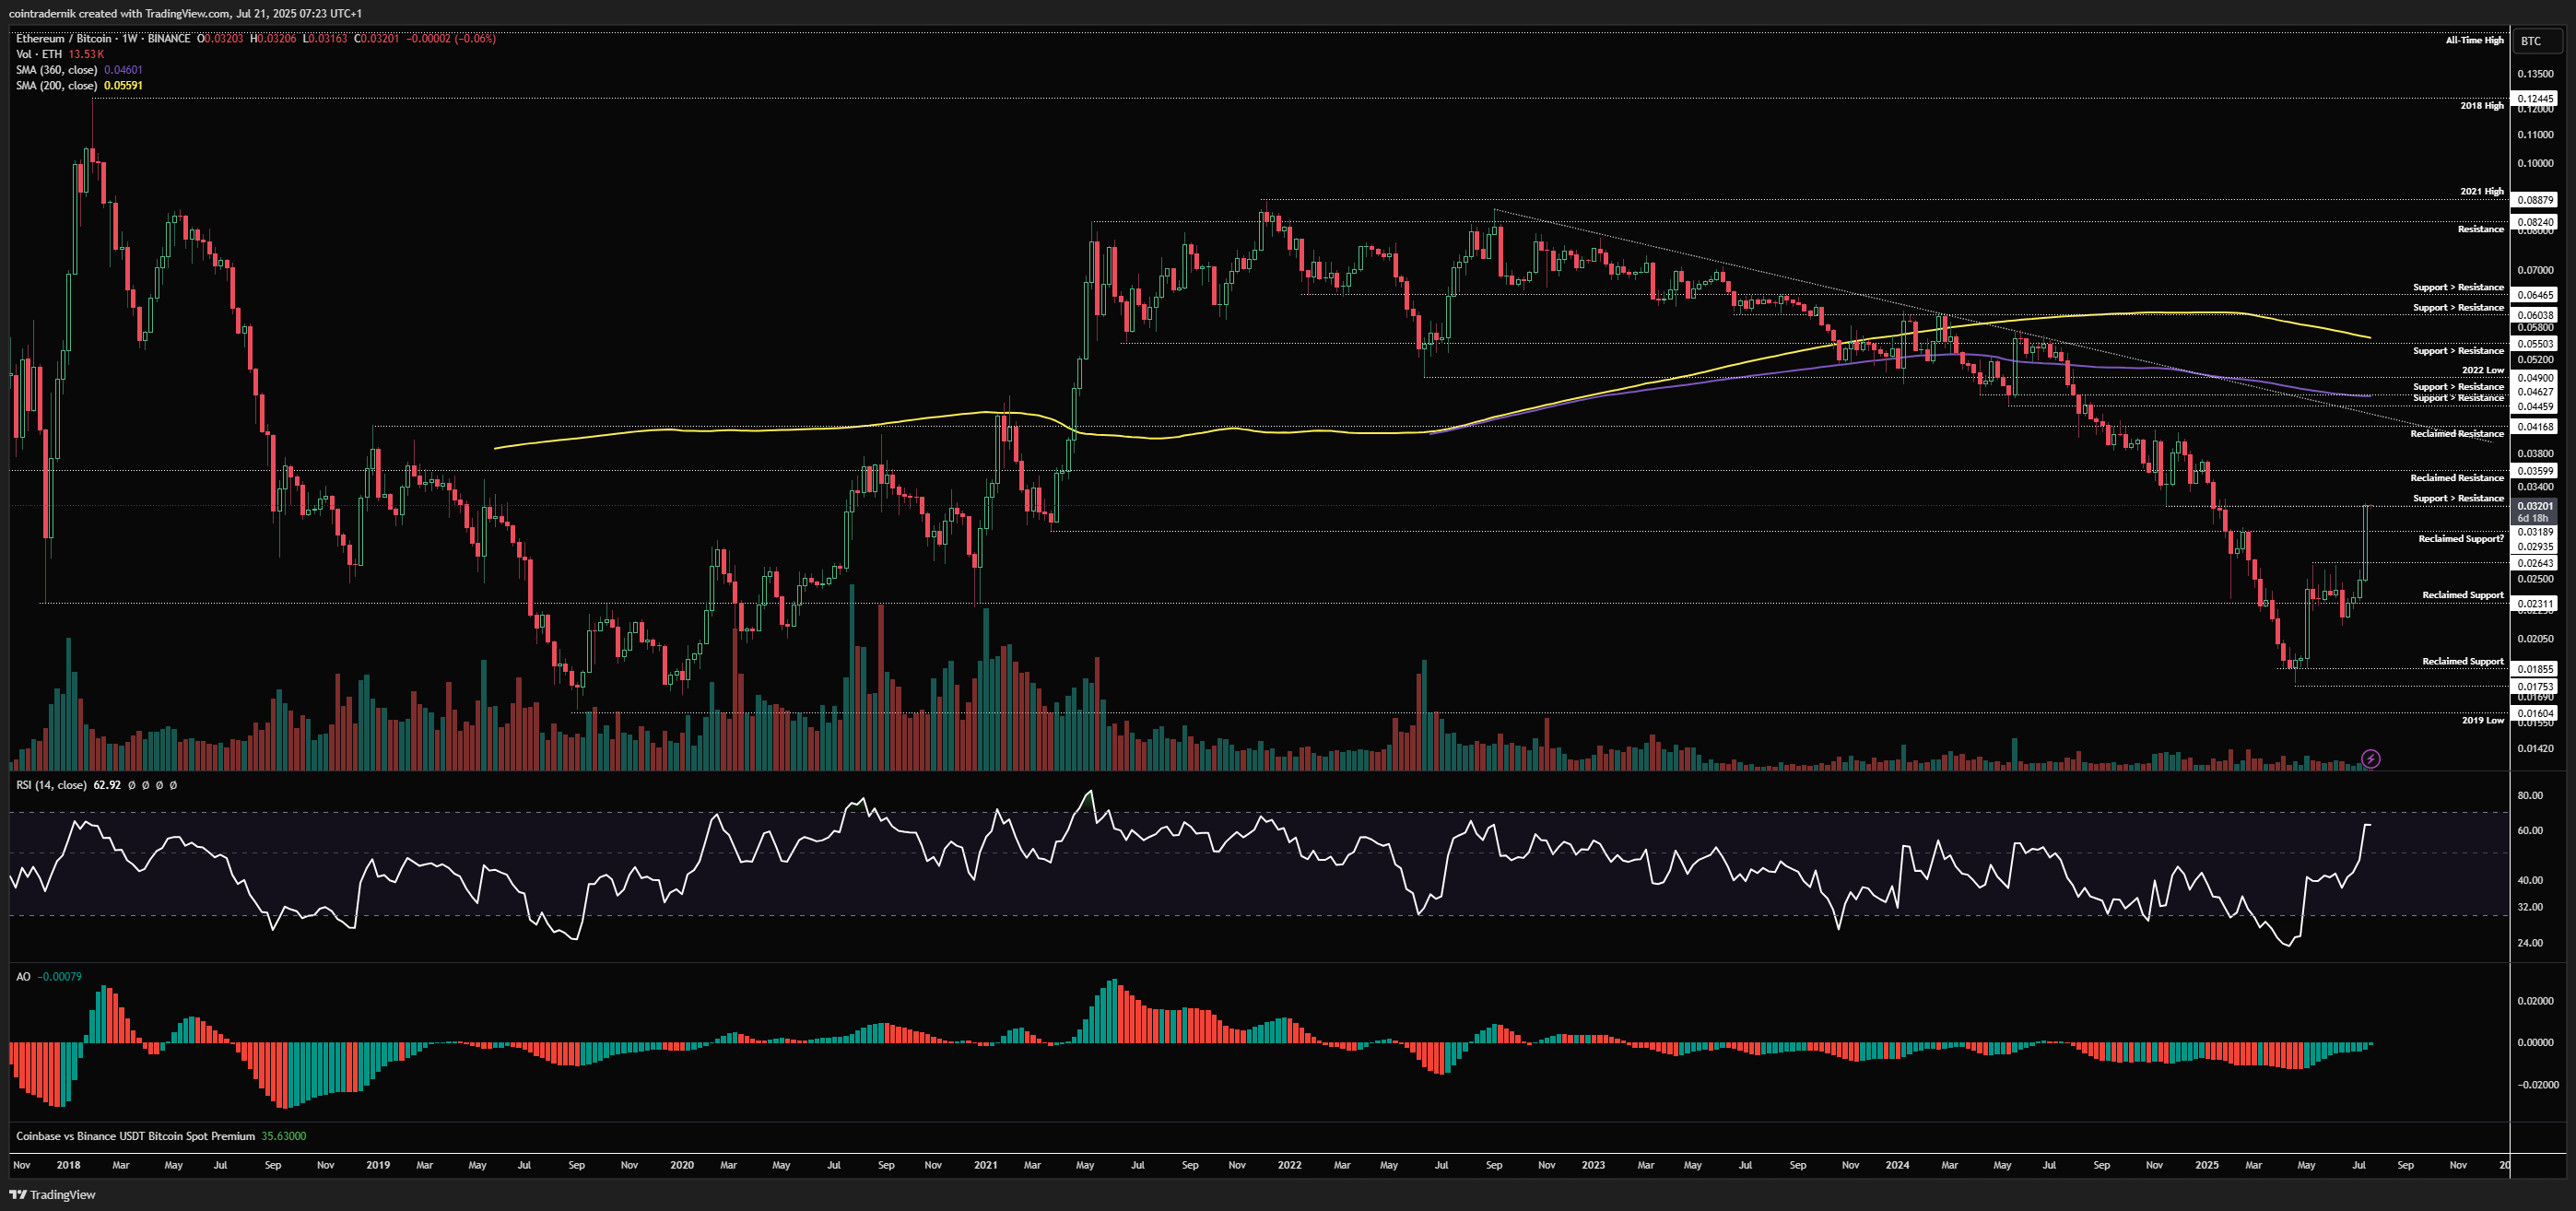
Weekly:
Looking at ETH/BTC on the weekly, we saw price push through local resistance at 0.0264 and squeeze higher, with weekly momentum at its highest since 2022. Price reclaimed 0.0294 with ease and closed out the week at 0.032. We do have some resistance here but given weekly momentum I would imagine we keep pushing from here into that 0.036 level before really struggling. Ultimately, this looks ready to rip towards long-term trendline resistance into 0.0418 over the coming weeks and months.
Daily:
Looking at the daily, again the squiggly played out perfectly with price reclaiming the 200dMA as support before breaking through 0.0264 and then ripping straight into the 360dMA, around which it is now sat. Until yesterday, ETH/BTC had not closed above its 360-day moving average since June 2023. This is very promising and at present there is no bearish divergence on momentum indicators. If we do reject here, I expect 0.0294 to act as support and price to continue from there into 0.036 as the next major level, with 0.0417 as the ultimate target beyond that.
Subscribe to Ostium Labs
Receive the latest updates directly to your inbox
Your subscription could not be saved. Please try again.
Your subscription has been successful.
Gold:
Price: $3369
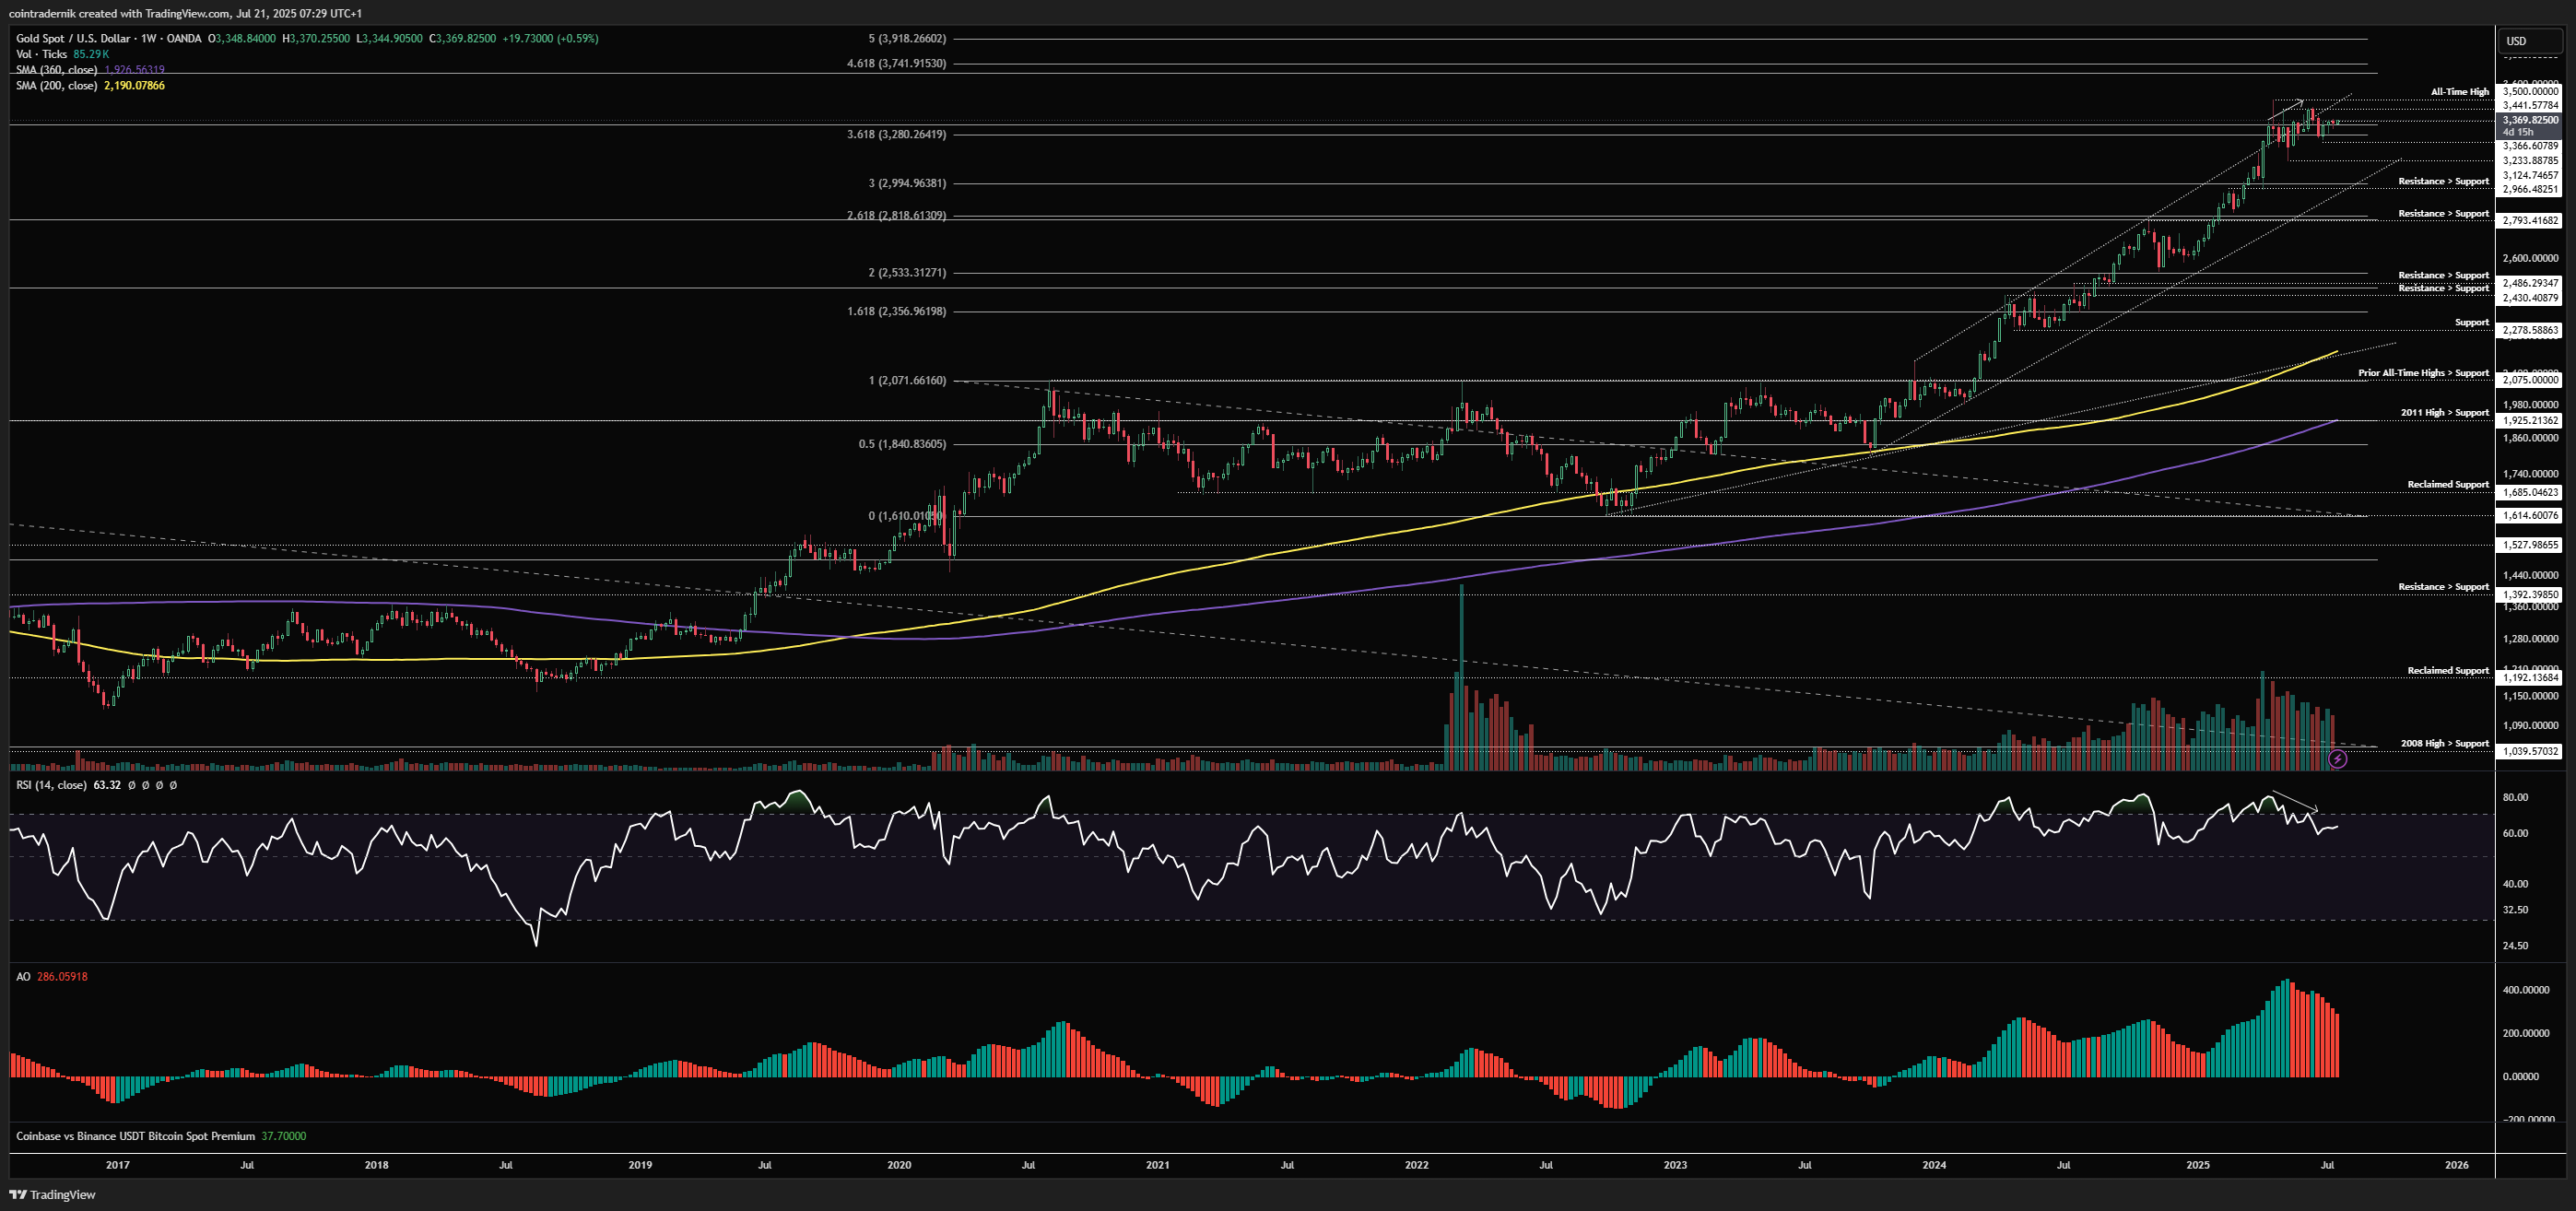
Weekly:
If we begin with the weekly for Gold, we can see that price formed a higher-low at $3233 within this choppy consolidation below the all-time highs and whilst we do still have bearish divergence here, there is a chance my mid-term view on Gold could be invalidated if we now close the weekly above $3440. Assuming $3440 does continue to cap price and we push lower, we need to see a weekly close below $3233 to confirm our view and from there it becomes probable that we take out $3124 and extend towards $2966. If this higher-low holds, and we see $3440 give way, we likely take out all-time highs at $3500 and begin another leg higher into $3740. Continuation of chop until we break either of those levels convincingly.
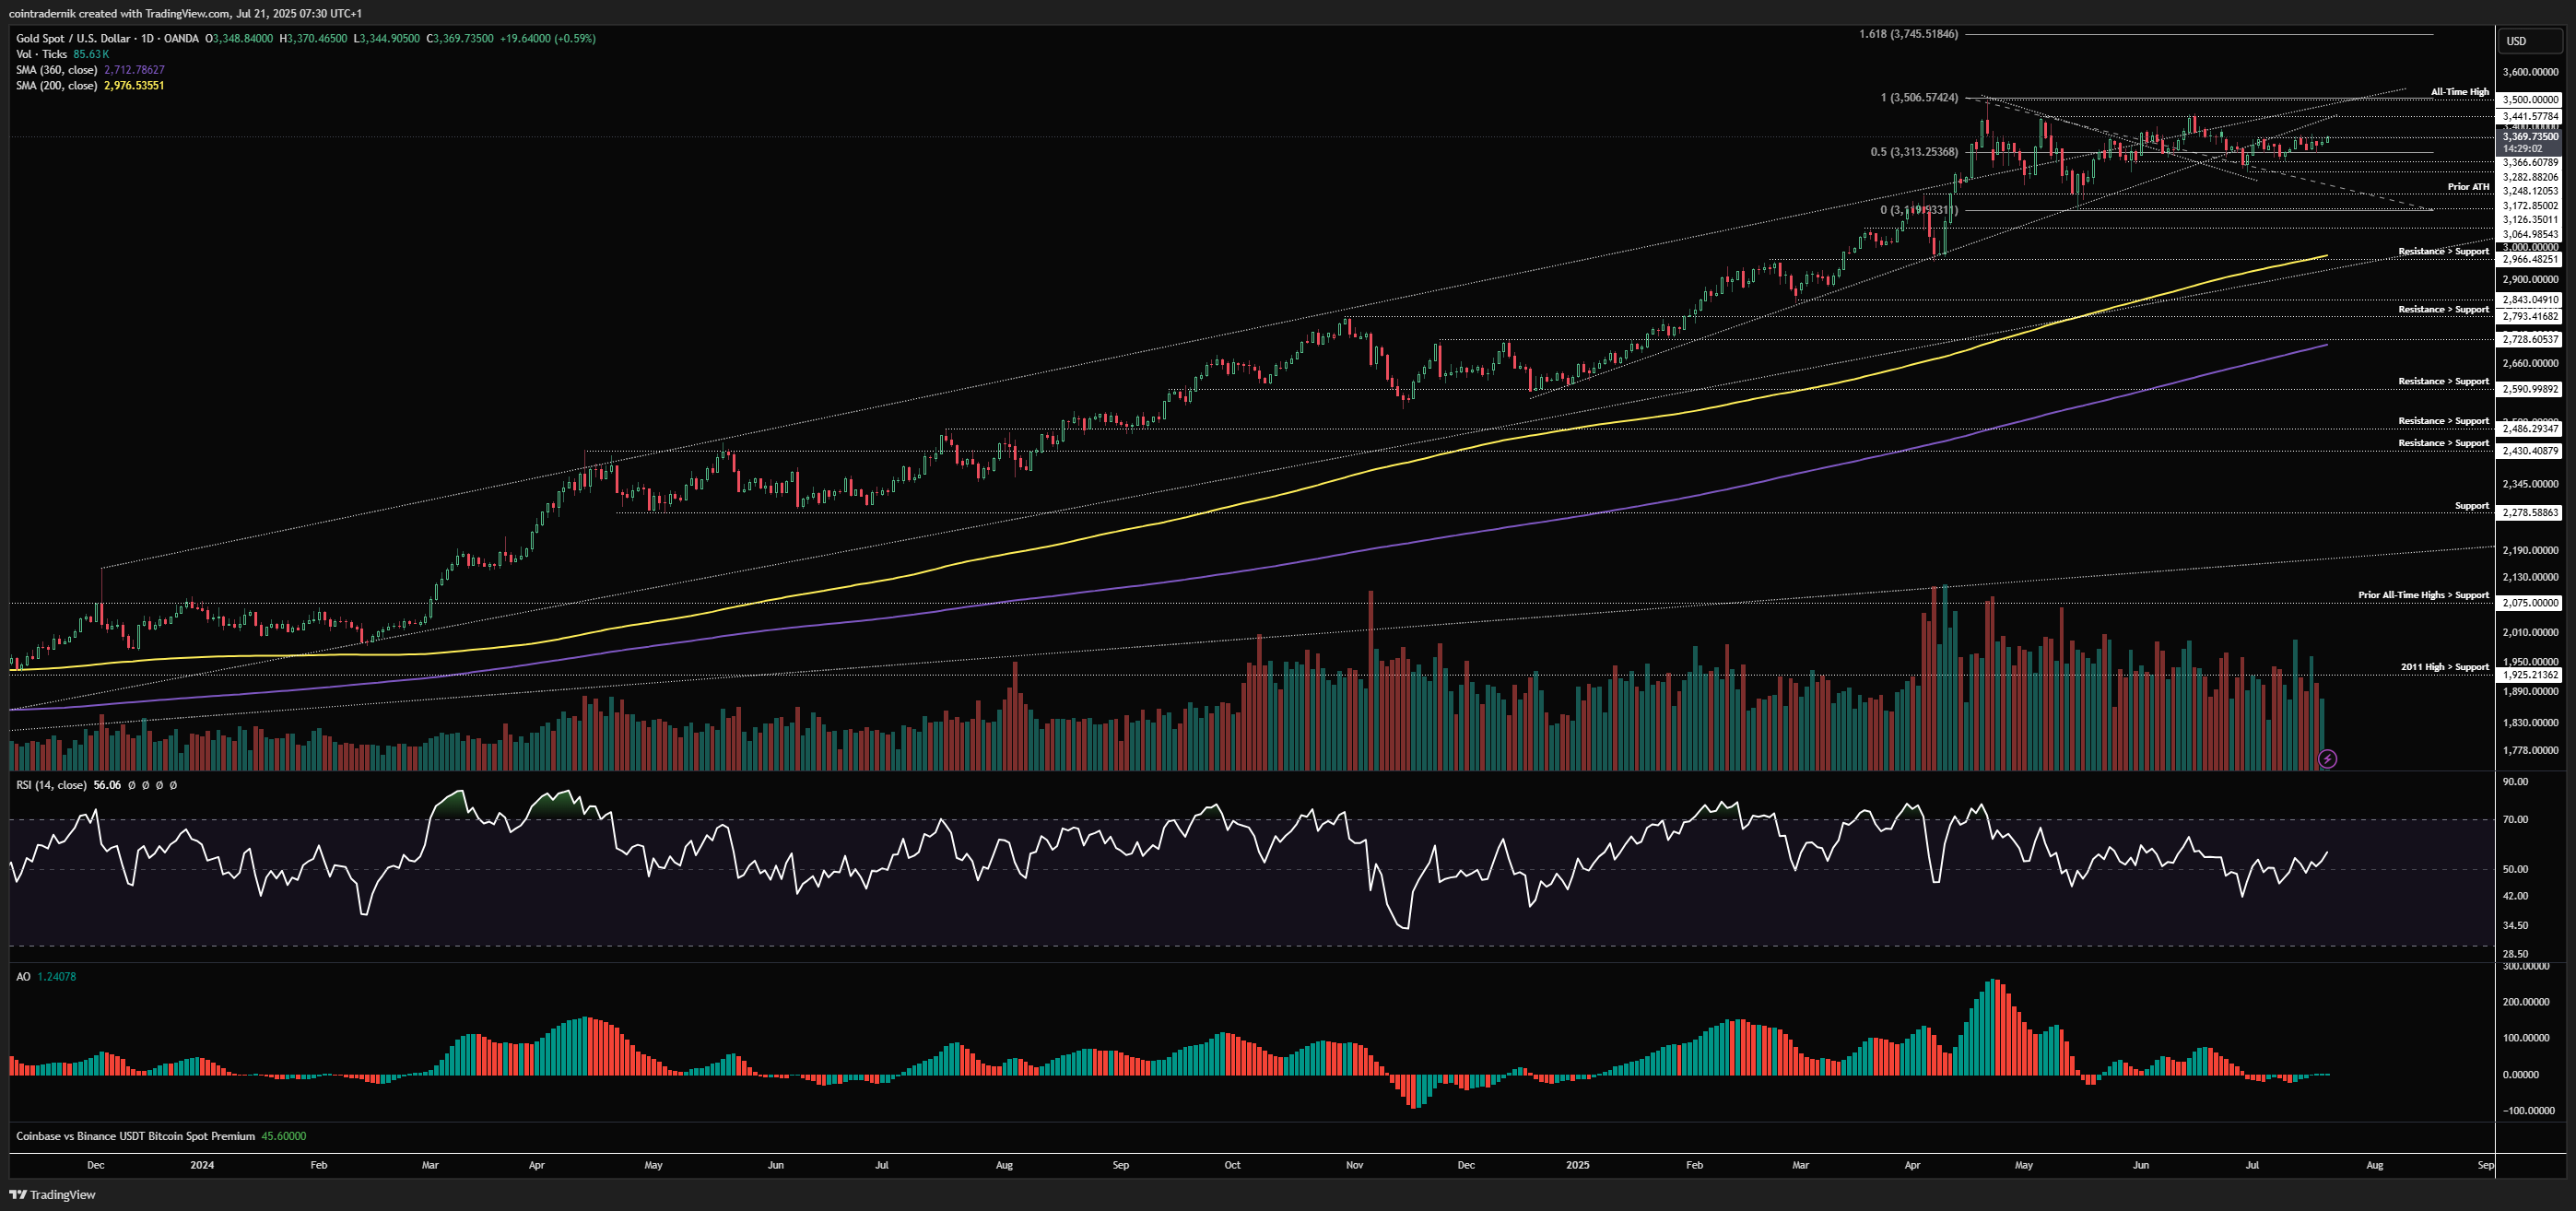
Daily:
Looking at the daily, we can see that momentum looks to have bottomed out here and is turning higher but we do still have very choppy structure, tighter in its range but similar to May, thus I don't want to jump the gun on expect a breakout to the upside of this range just yet. If we do reject below $3440, watch for daily structure to turn bearish subsequently and that likely sends this much lower. Difficult to get a read on this at the moment admittedly, but likely much hinges on whether the dollar can continue to squeeze short positioning into August or whether it rolls over and continues its bearish trend.
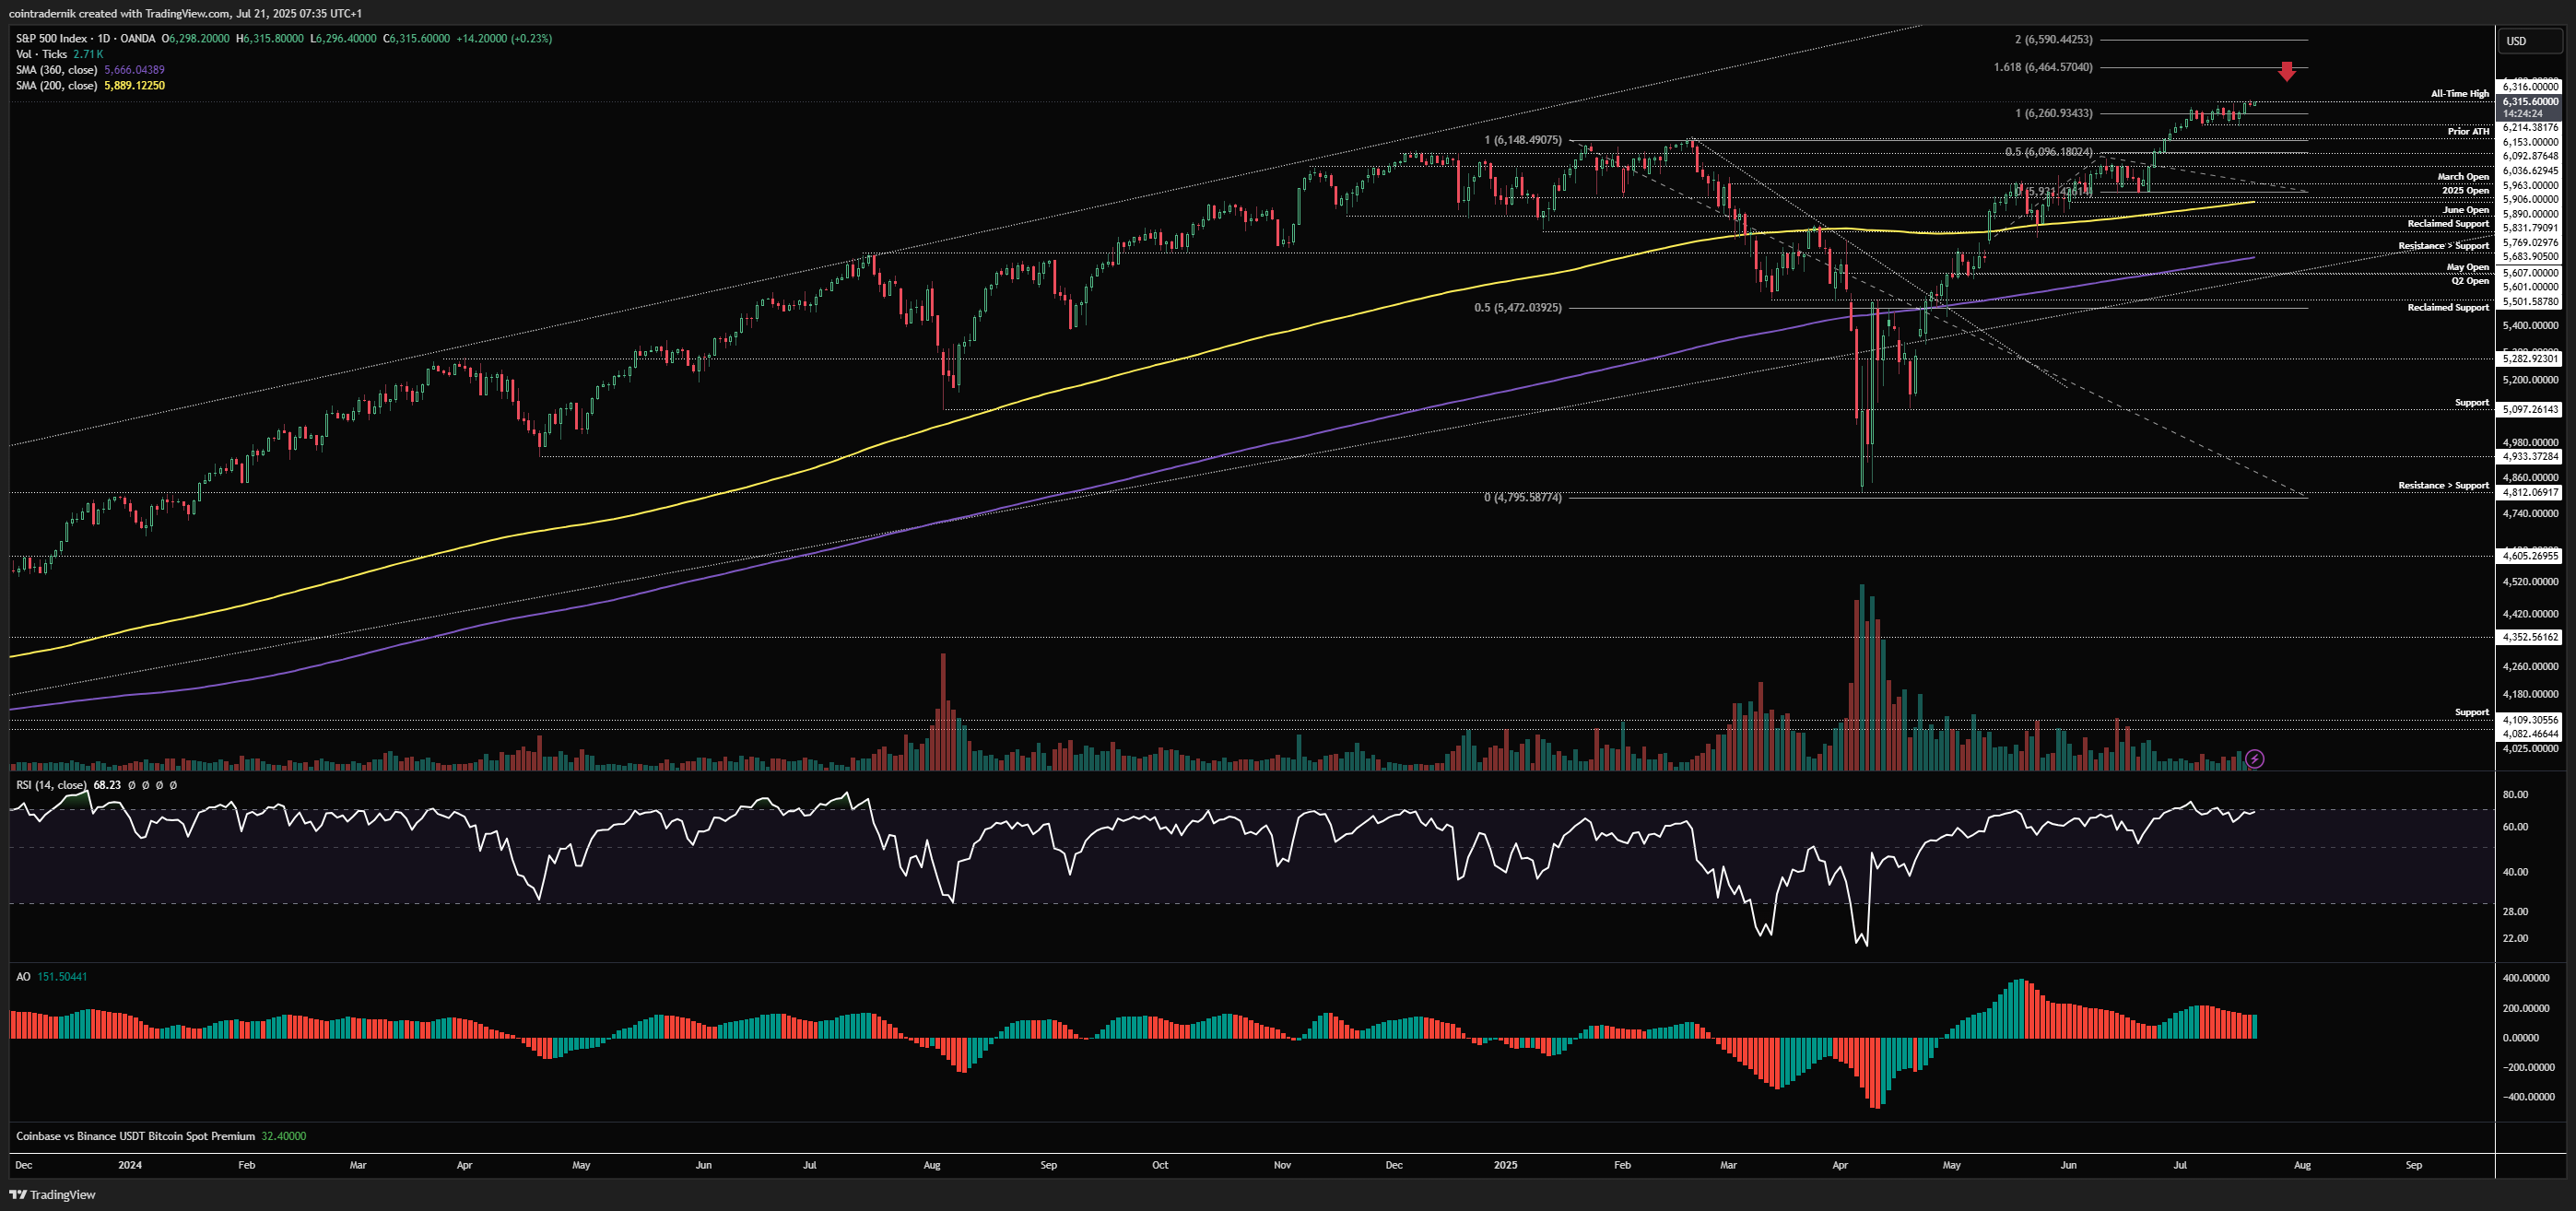
SPX:
Price: $6315
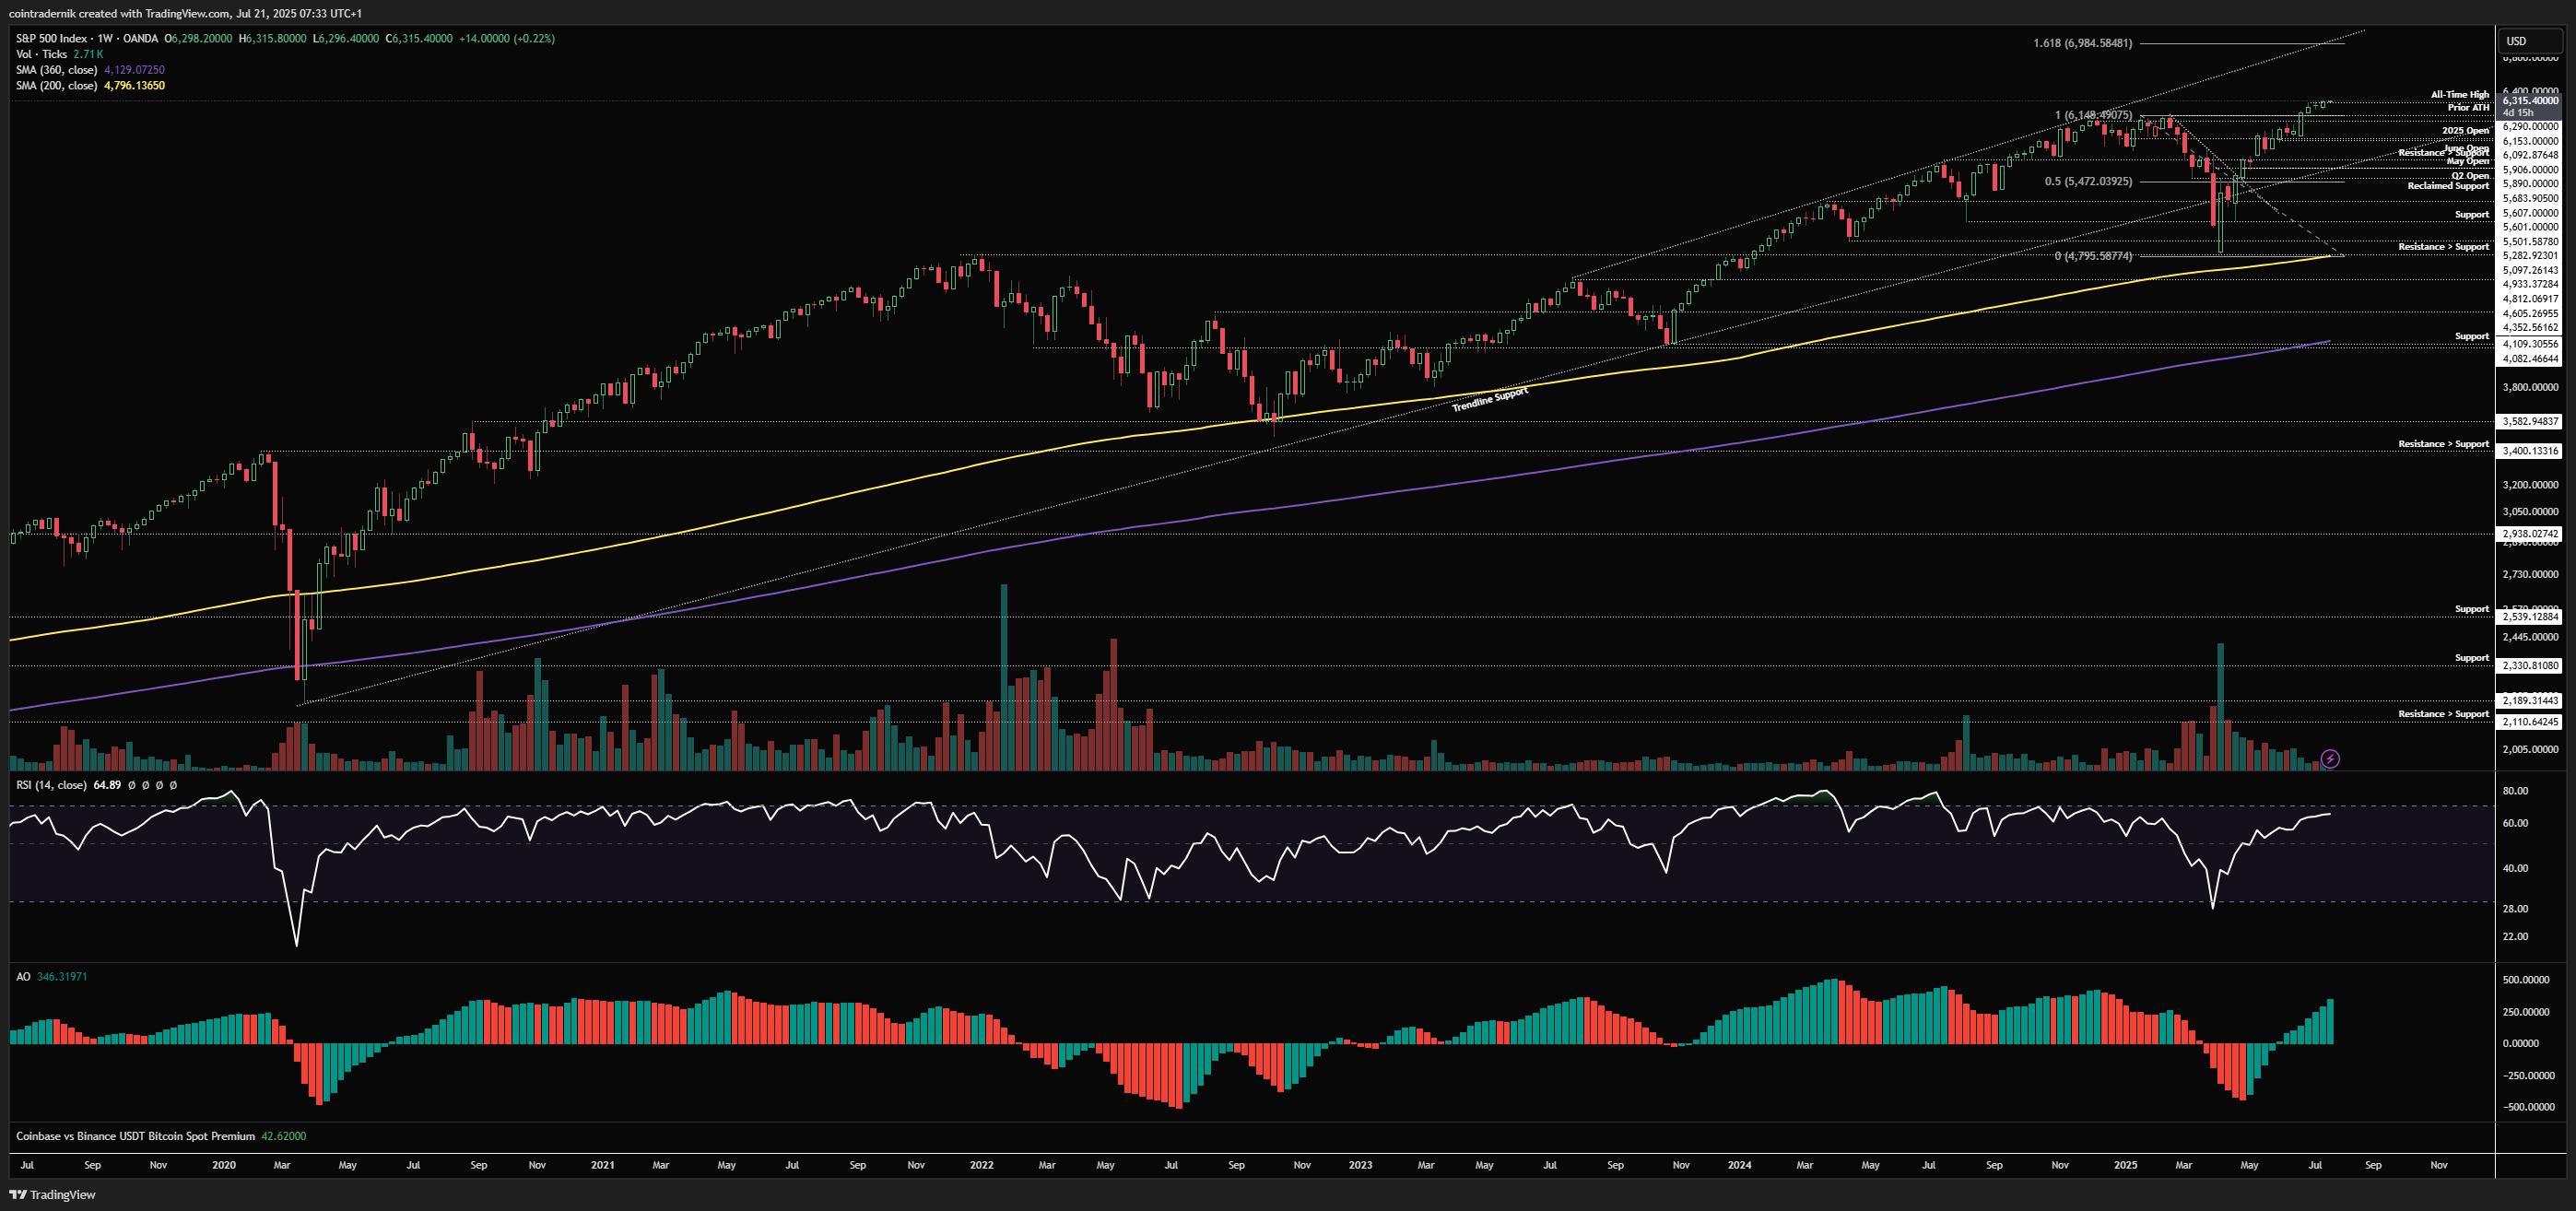
Weekly:
Beginning with the weekly view for SPX, we can see that equities closed last week at fresh all-time highs on growing momentum, so we should see continuation higher this week as we approach the end of the strong seasonal window. I fully anticipate some profit-taking to occur into month-end and derisking into July FOMC, with parts of August seasonally weak for equities. As such, if we do get that push higher this week, it might be worth buying some downside protection. Given that we have not extended as high as the $64xx region in July (at least not yet), I do not think the correction will be a very deep one and thus I am currently not looking to exit my equity positioning from April lows for the sake of what may only be a 5-7% pullback into September. If we do rip much higher this week, I will reassess, with $6460 as a key area I am looking at for a larger pullback. Sentiment and positioning is still not euphoric by any means, which also feeds into this idea of a shallower pullback. Nonetheless, at the very least I will buy some hedges this week.
Daily:
Turning to the daily, we can see that price is breaking higher here after some consolidation at the highs and any minor bearish divergence looks ready to be invalidated, where acceptance above 6315 this week with daily RSI above 70 would lead to further upside. As mentioned before, $646x is the 1.618 extension of this upswing and also about 10% above the yearly open, hence if we do extend into that level this week I would be looking to fully exit longs with a view to rebuy lower going into September. If we just chop around these highs I will not exit and instead just buy some protection, but nothing right here is menaingfully overextended.
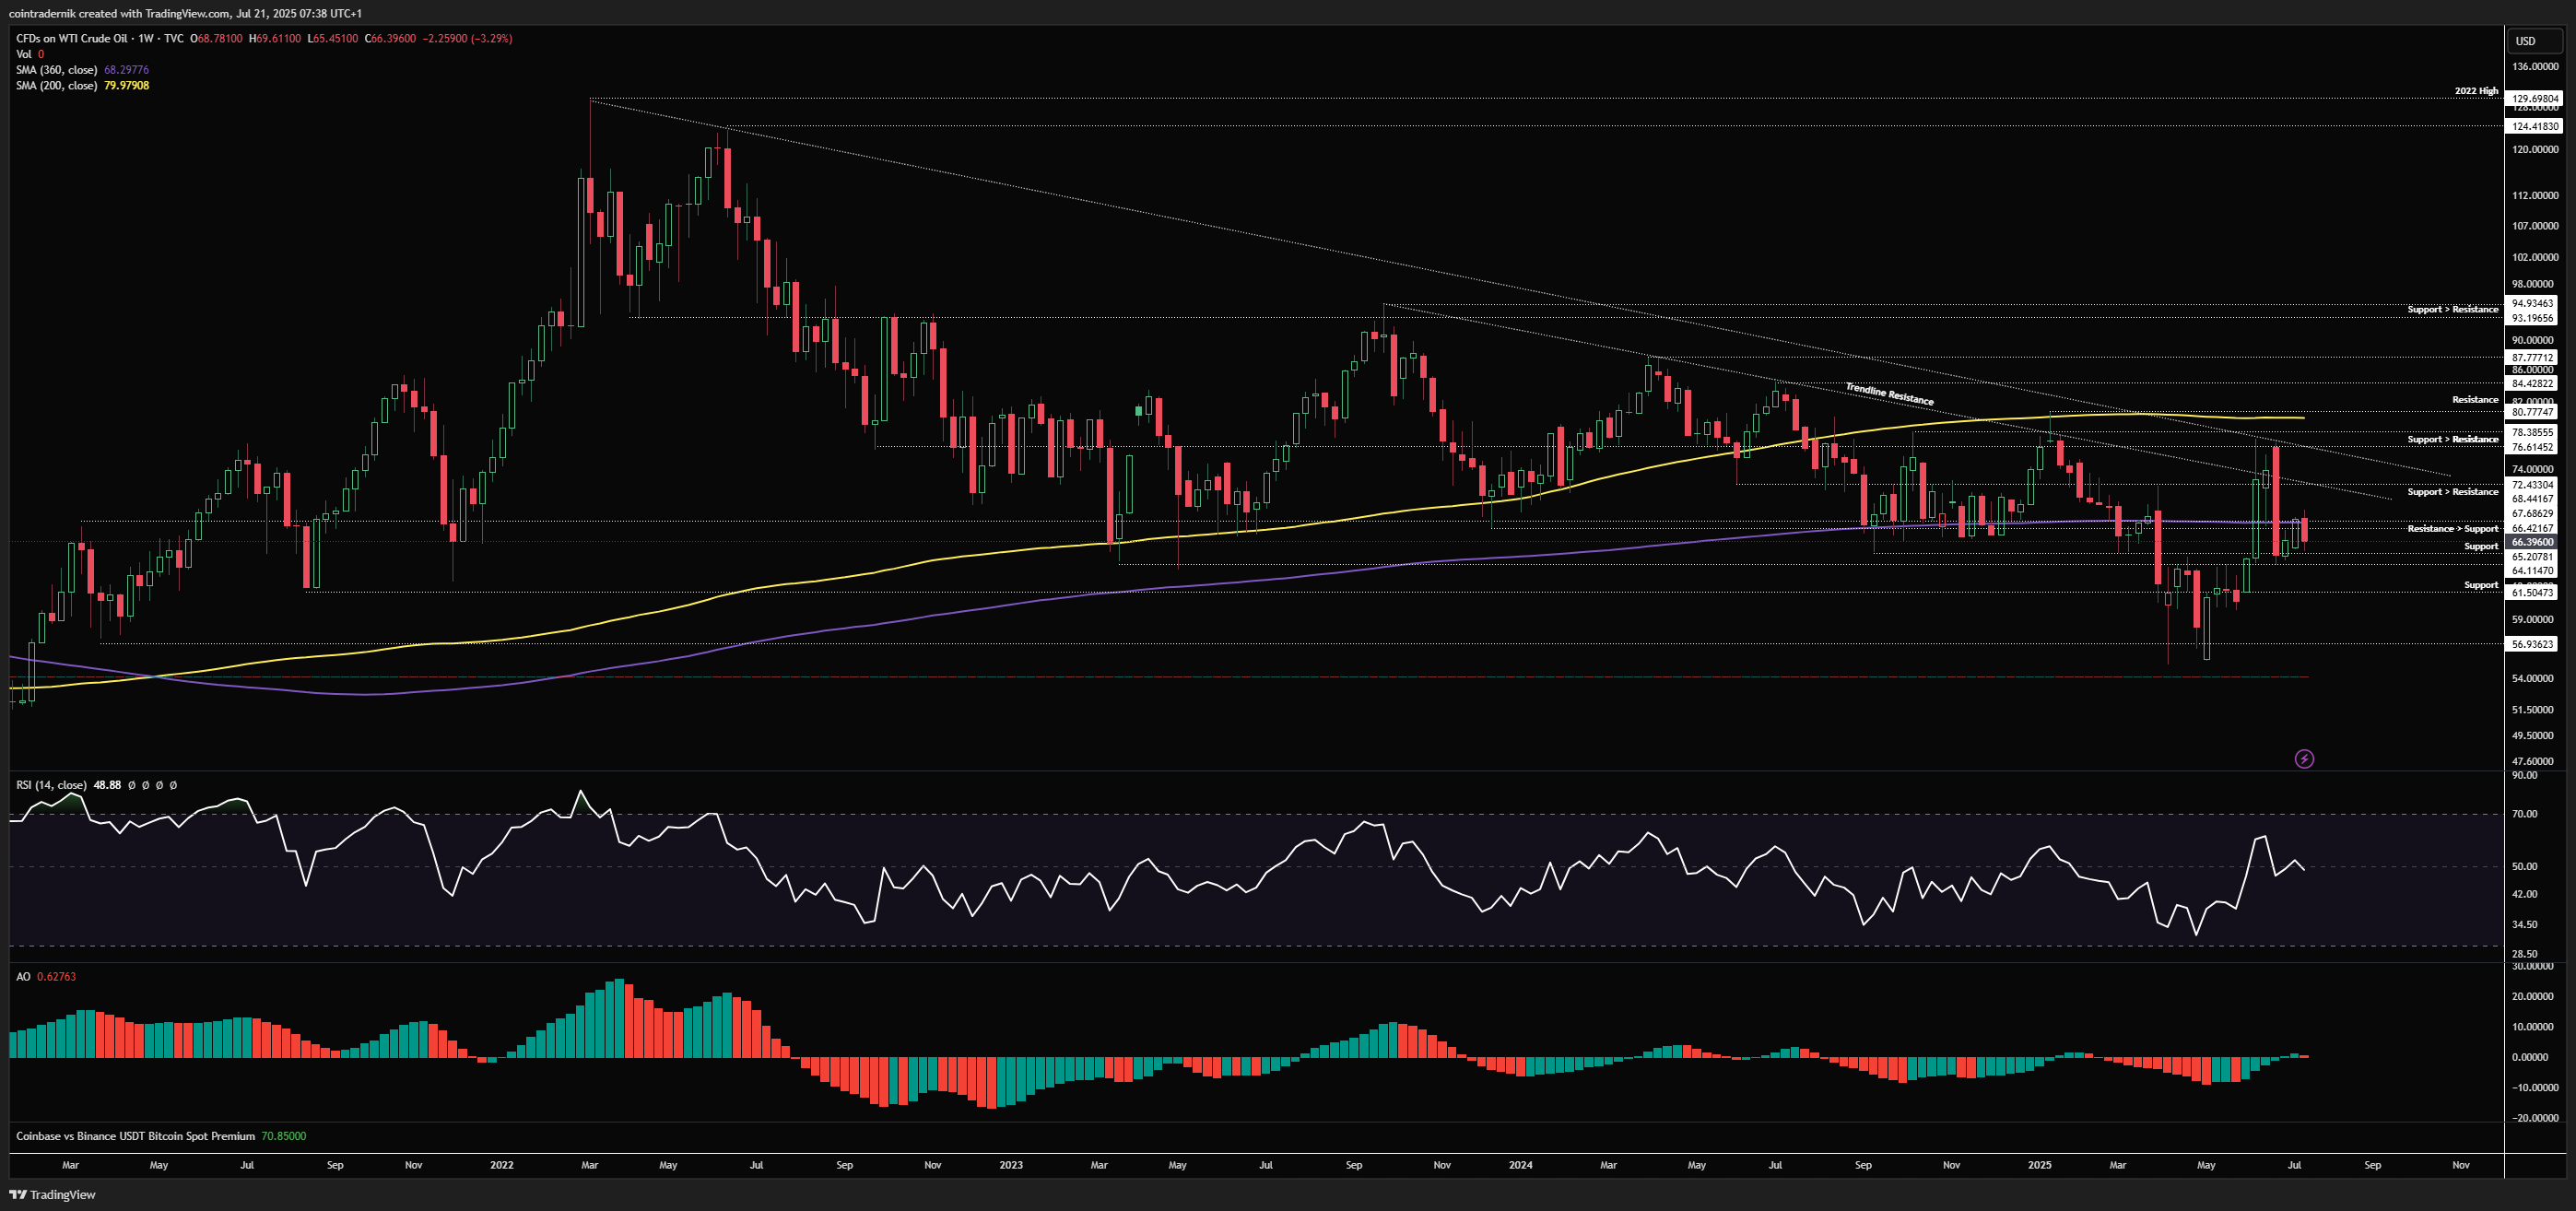
Crude Oil:
Price: $66.40
Weekly:
Despite the tariff tantrums and geopolitical scares, the weekly view for Crude Oil continues to show a choppy downtrend where any rallies continue to be faded below the 200wMA. Price rejected trendline resistance and sold off, pushing back into local support above $64, where it is now consolidating. I expect we see continued chop between $57 and $76 over the coming months as opposed to a breakout either side of this range, so if we get another leg lower into $61.50 I will be looking for lower timeframe exhaustion to enter longs back towards at least $68 if not $72. Not much else to add here.
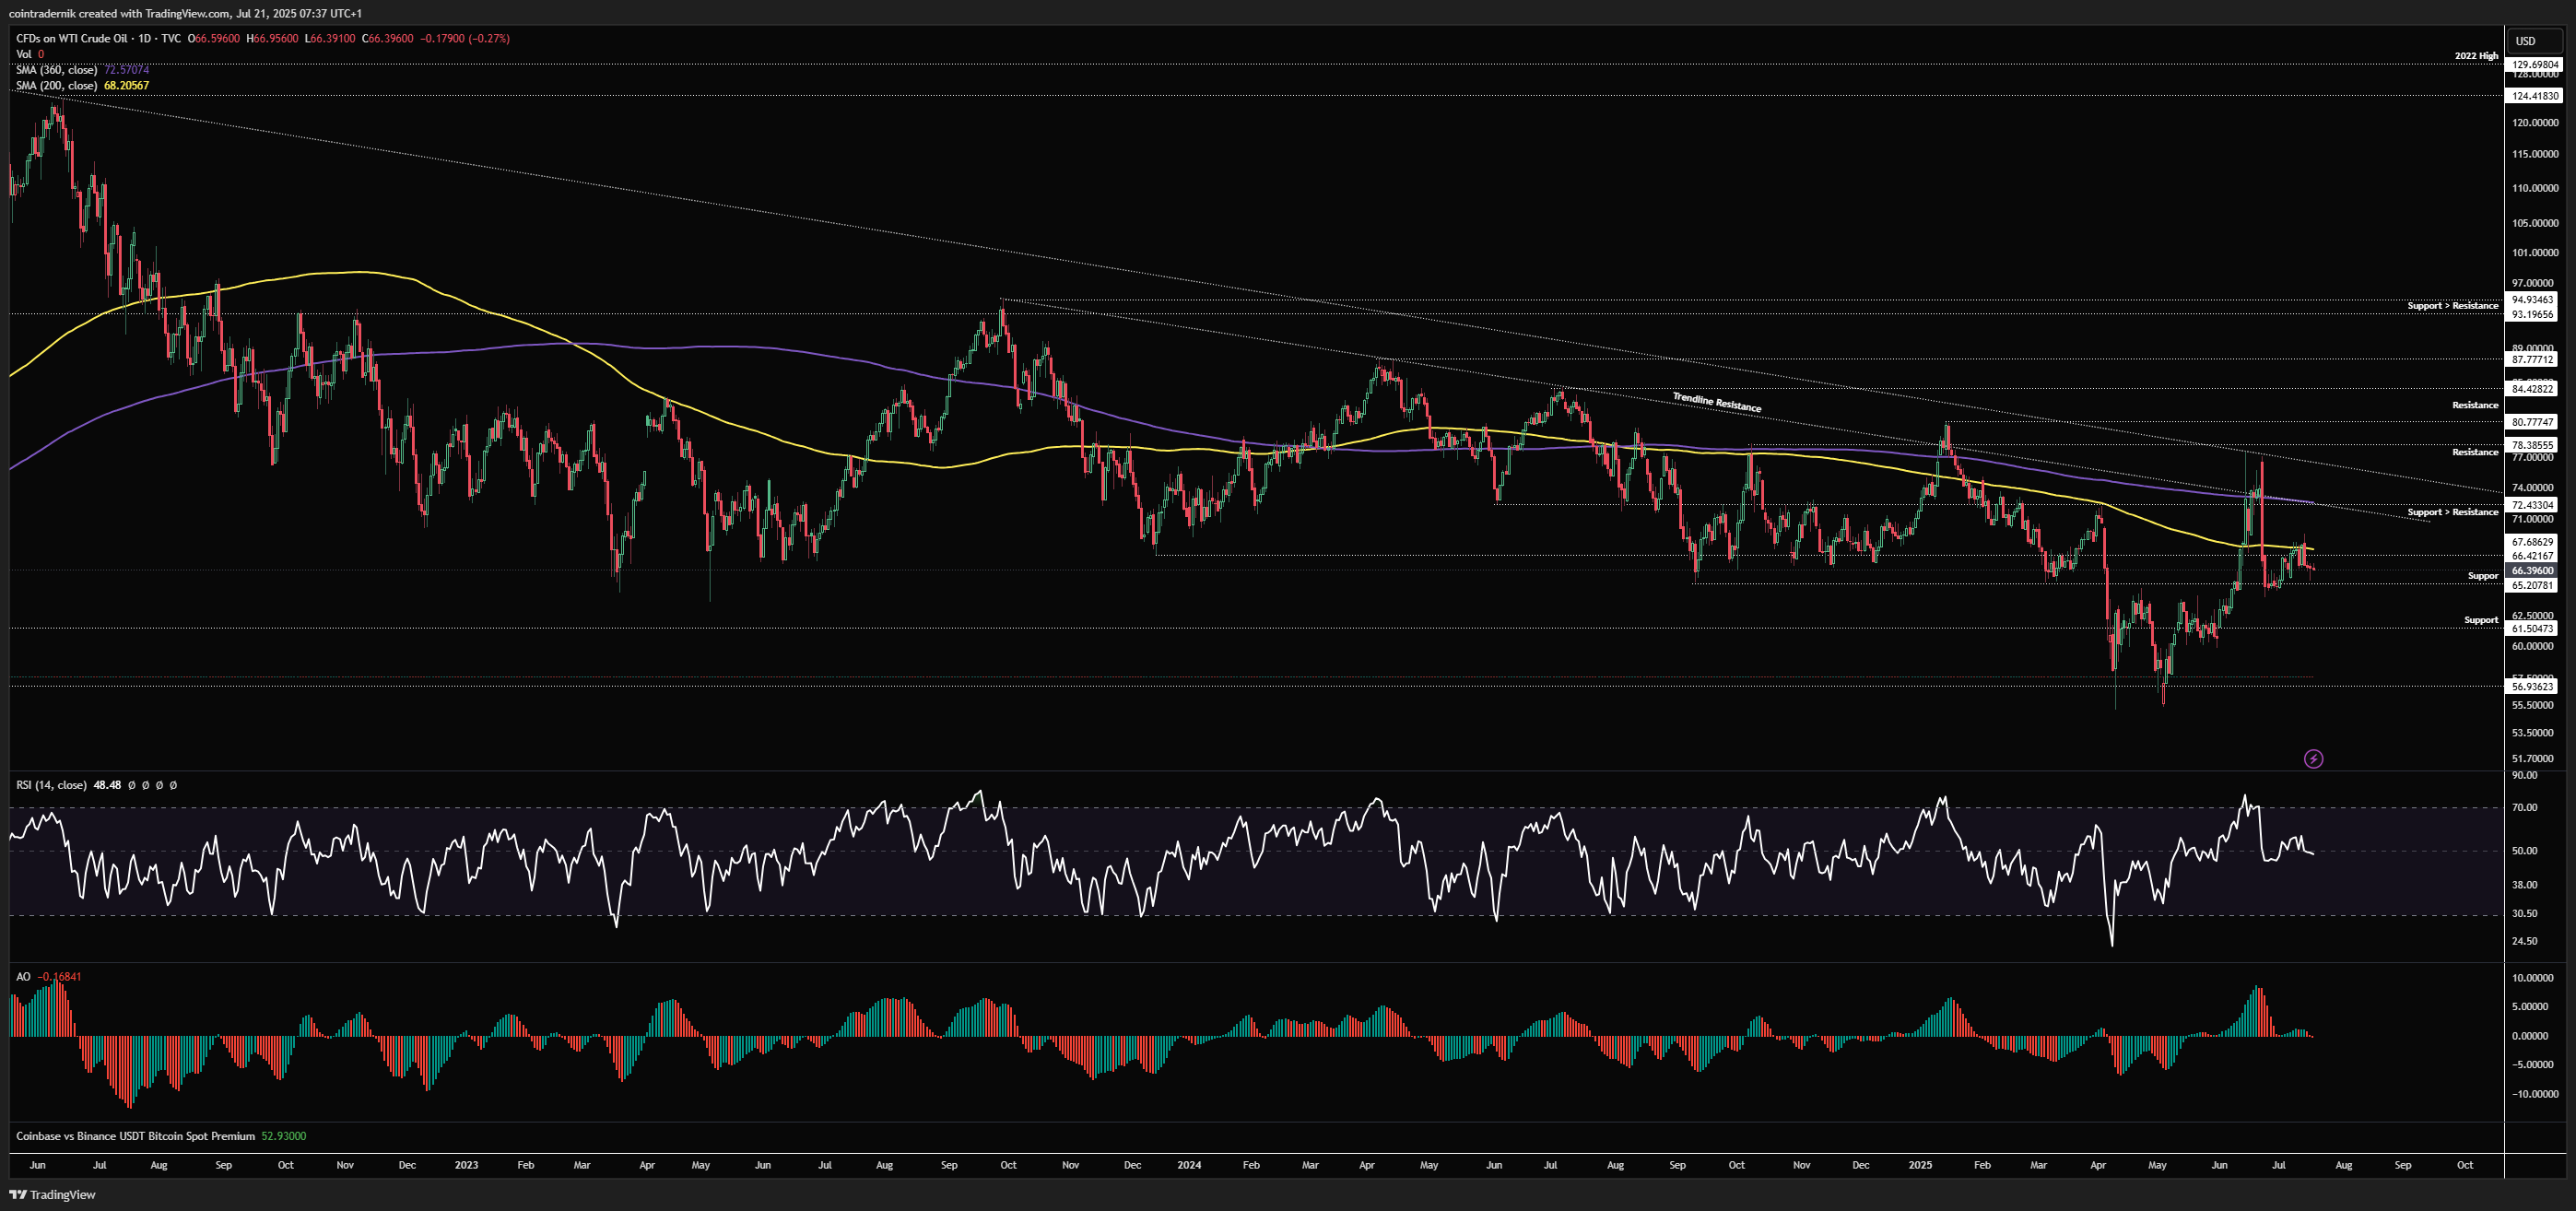
Daily:
Finally, looking at the daily, we can see that daily structure is technically bullish but this is obviously within a broader downtrend, hence the extremely choppy price-action and momentum. We are currently capped by the 200dMA and rallies into the 360dMA have offered great opportunities to fade over the past year. If we break below $65.20 support here, I think we retest that lower level of support at $61.50 where I will be looking for long setups, with a close below $58 as a hard invalidation on any of those longs. Rally from here up into $72.50 and I will look to slap it back down.
I hope you've found some value in the read this week!
And if you've not already signed up for Ostium, please do so and test out some of the recent updates, including:
On-chain leverage for indices including NDX, SPX, FTSE & more...
Unified accounts and gas-free trading
Single-stock perpetuals, including TSLA, NVDA and META


.png)
-2025-07-21_06_48_11.png)