This blog references an opinion and is for entertainment and informational purposes only. It is not intended to be investment advice. Seek a duly licensed professional for investment advice.
In this 44th Market Outlook here at Ostium Research, we'll be taking a look at the week ahead in markets, focusing specifically on price-action, positioning and event risk for Bitcoin, Ethereum, Copper, DXY and altcoins via OTHERS.
Firstly, let's take a look at the extremely stacked calendar for the week ahead:
TUESDAY: US JOLTS JOB OPENINGS (JUN): (CONSENSUS 7.35M VS PREVIOUS 7.769M)
WEDNESDAY: US ADP EMPLOYMENT CHANGE (JUL): (CONSENSUS 75K VS PREVIOUS -33K)
WEDNESDAY: US GDP ANNUALIZED (Q2): (CONSENSUS 2.5% VS PREVIOUS -0.5%)
WEDNESDAY: BANK OF CANADA INTEREST RATE DECISION: (CONSENSUS 2.75% VS PREVIOUS 2.75%)
WEDNESDAY: FED INTEREST RATE DECISION: (CONSENSUS 4.5% VS PREVIOUS 4.5%)
THURSDAY: BANK OF JAPAN INTEREST RATE DECISION: (CONSENSUS 0.5% VS PREVIOUS 0.5%)
THURSDAY: US INITIAL JOBLESS CLAIMS: (CONSENSUS 220K VS PREVIOUS 217K)
THURSDAY: US CORE PERSONAL CONSUMPTION EXPENDITURES (MOM) (JUN): (CONSENSUS 0.3% VS PREVIOUS 0.2%)
FRIDAY: US NONFARM PAYROLLS (JUL): (CONSENSUS 102K VS PREVIOUS 147K)
FRIDAY: US ISM MANUFACTURING PMI (JUL): (CONSENSUS 49.6 VS PREVIOUS 49)
Now, let's dig into asset-specific price-action for the week ahead, looking firstly at Bitcoin:
Bitcoin:
Price: $118,994
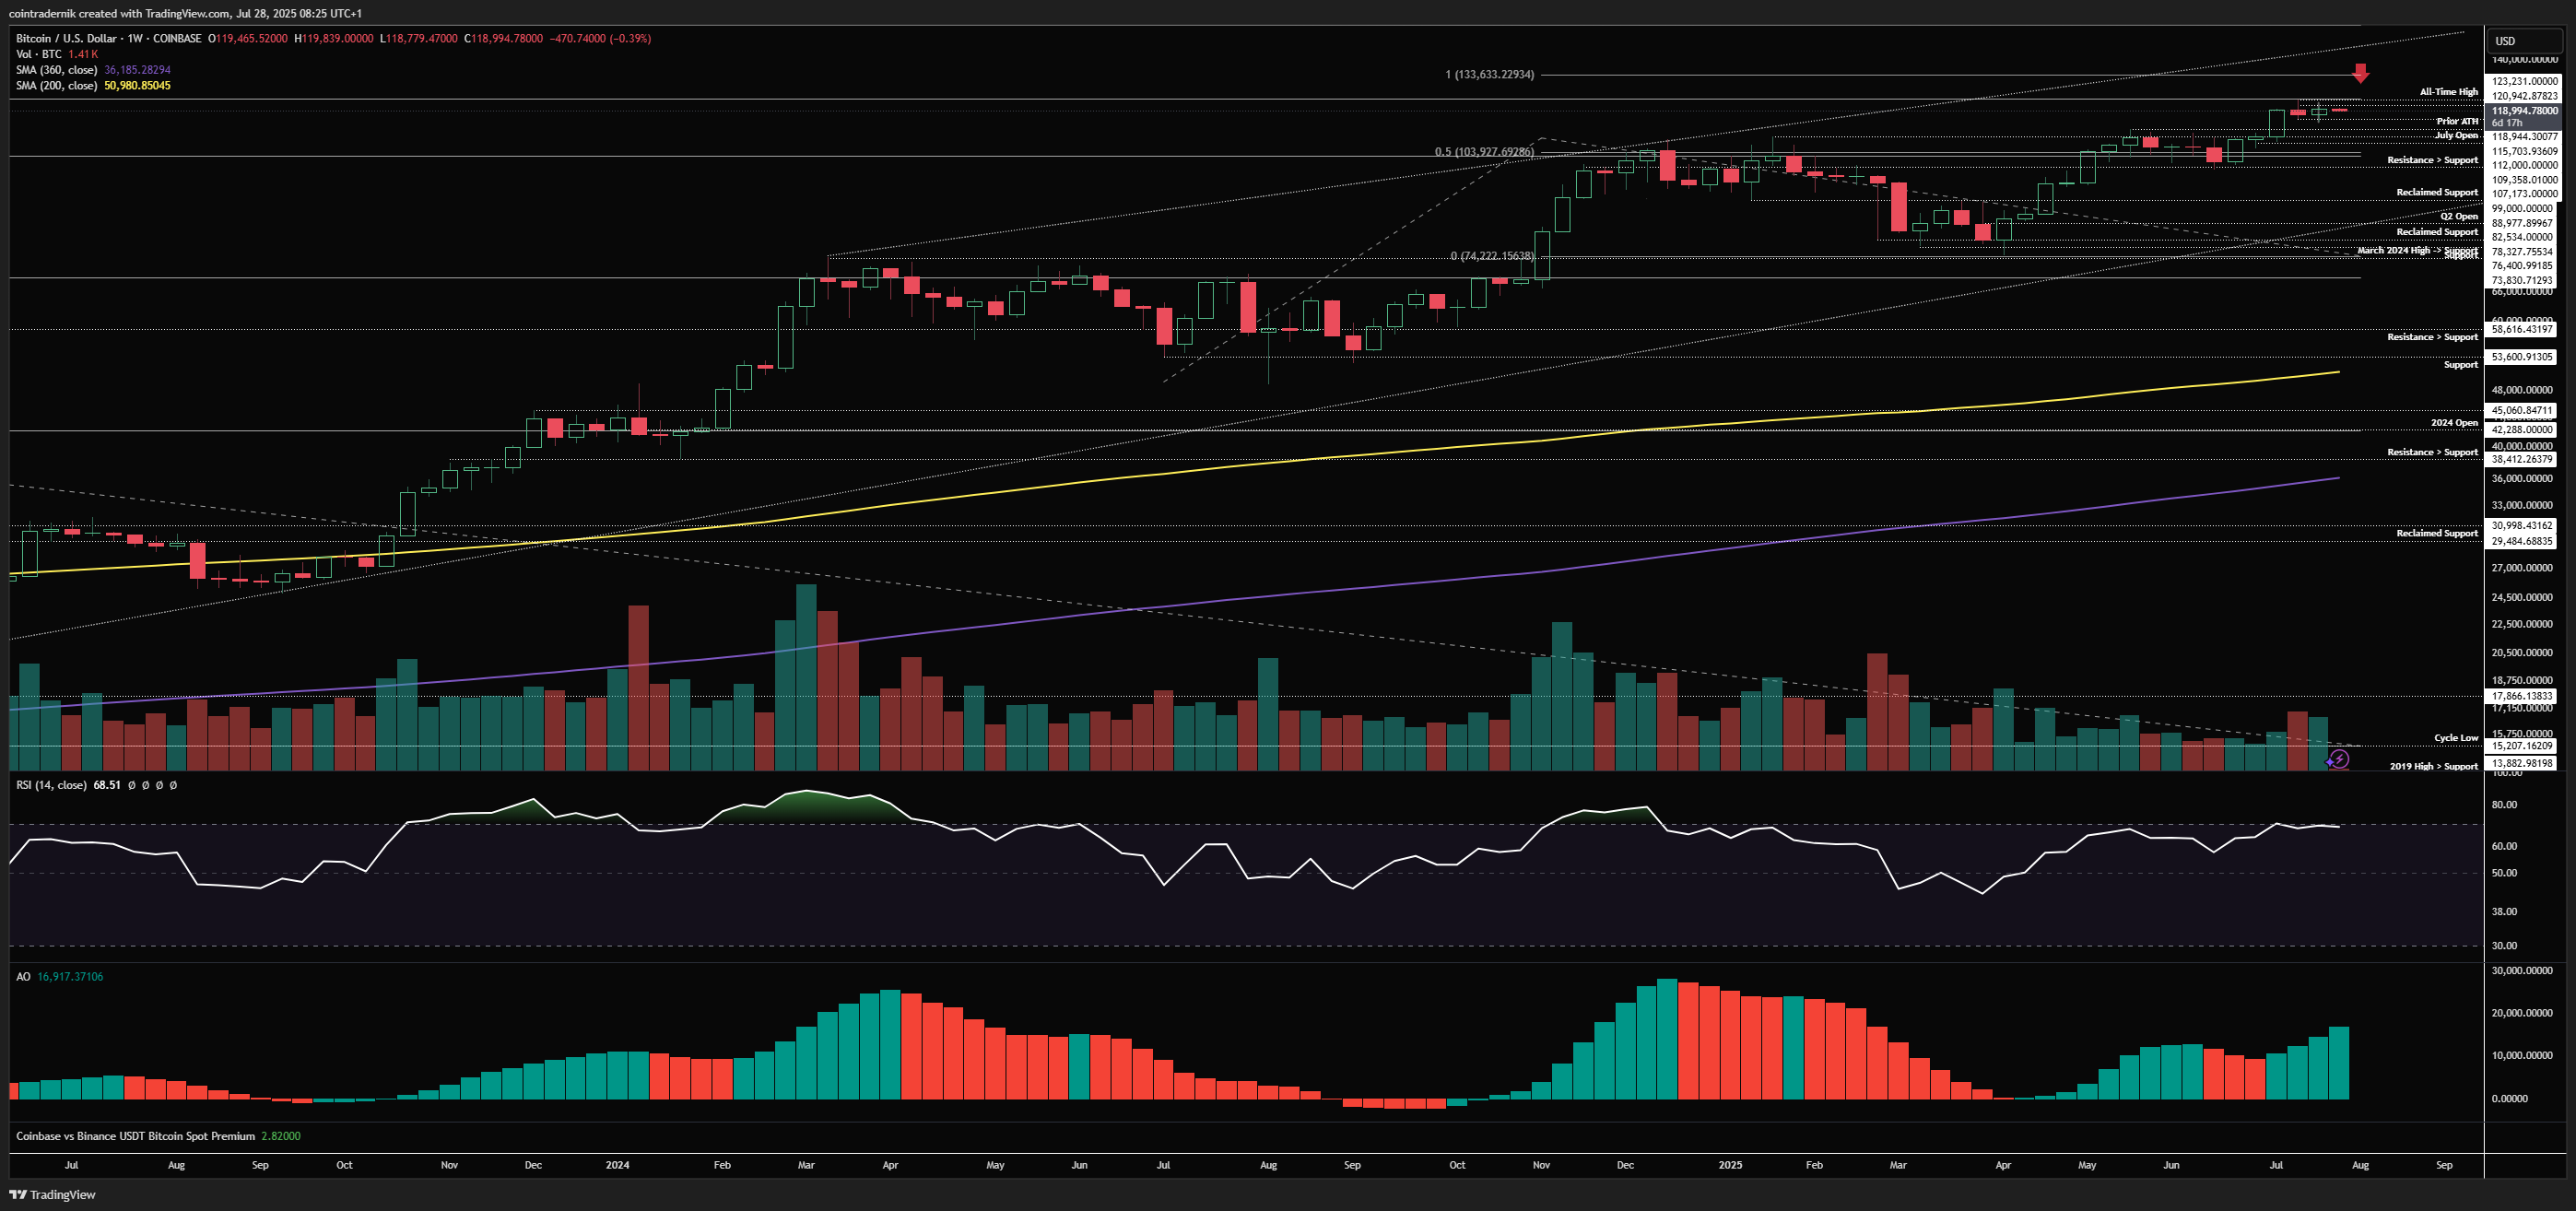
Weekly:
If we begin by looking at BTC/USD on the weekly, we can see that last week saw price continue to chop around in this tight range below all-time highs, marginally bouncing off local support at $115.7k to close the week back at $119.4k for an all-time high weekly close on decent volume. We have a hugely volatile week ahead - one of the most stacked of the calendar year as far as headline risk is concerned - and during any other week I would have taken last week's close as a sign of imminent price discovery; given the week ahead, however, we have many unknowns that need to be clarified (primarily around forthcoming fiscal and monetary policy) and what I would like to see is some derisking into mid-week that leads to a reversal and weekly (and monthly) close above $121k. This would make it very probable in my view that the more typical choppy August is unlikely and instead crypto continues to grind higher throughout summer into September, where a correction is more likely; conversely, taking out some local highs early this week and then rejecting into the weekly close to close below $115k would be bearish for August, where I would expect more chop and a retest of the $110k area. There is nothing currently as pertains to structure or momentum on this timeframe that would be suggestive of more downside than that.
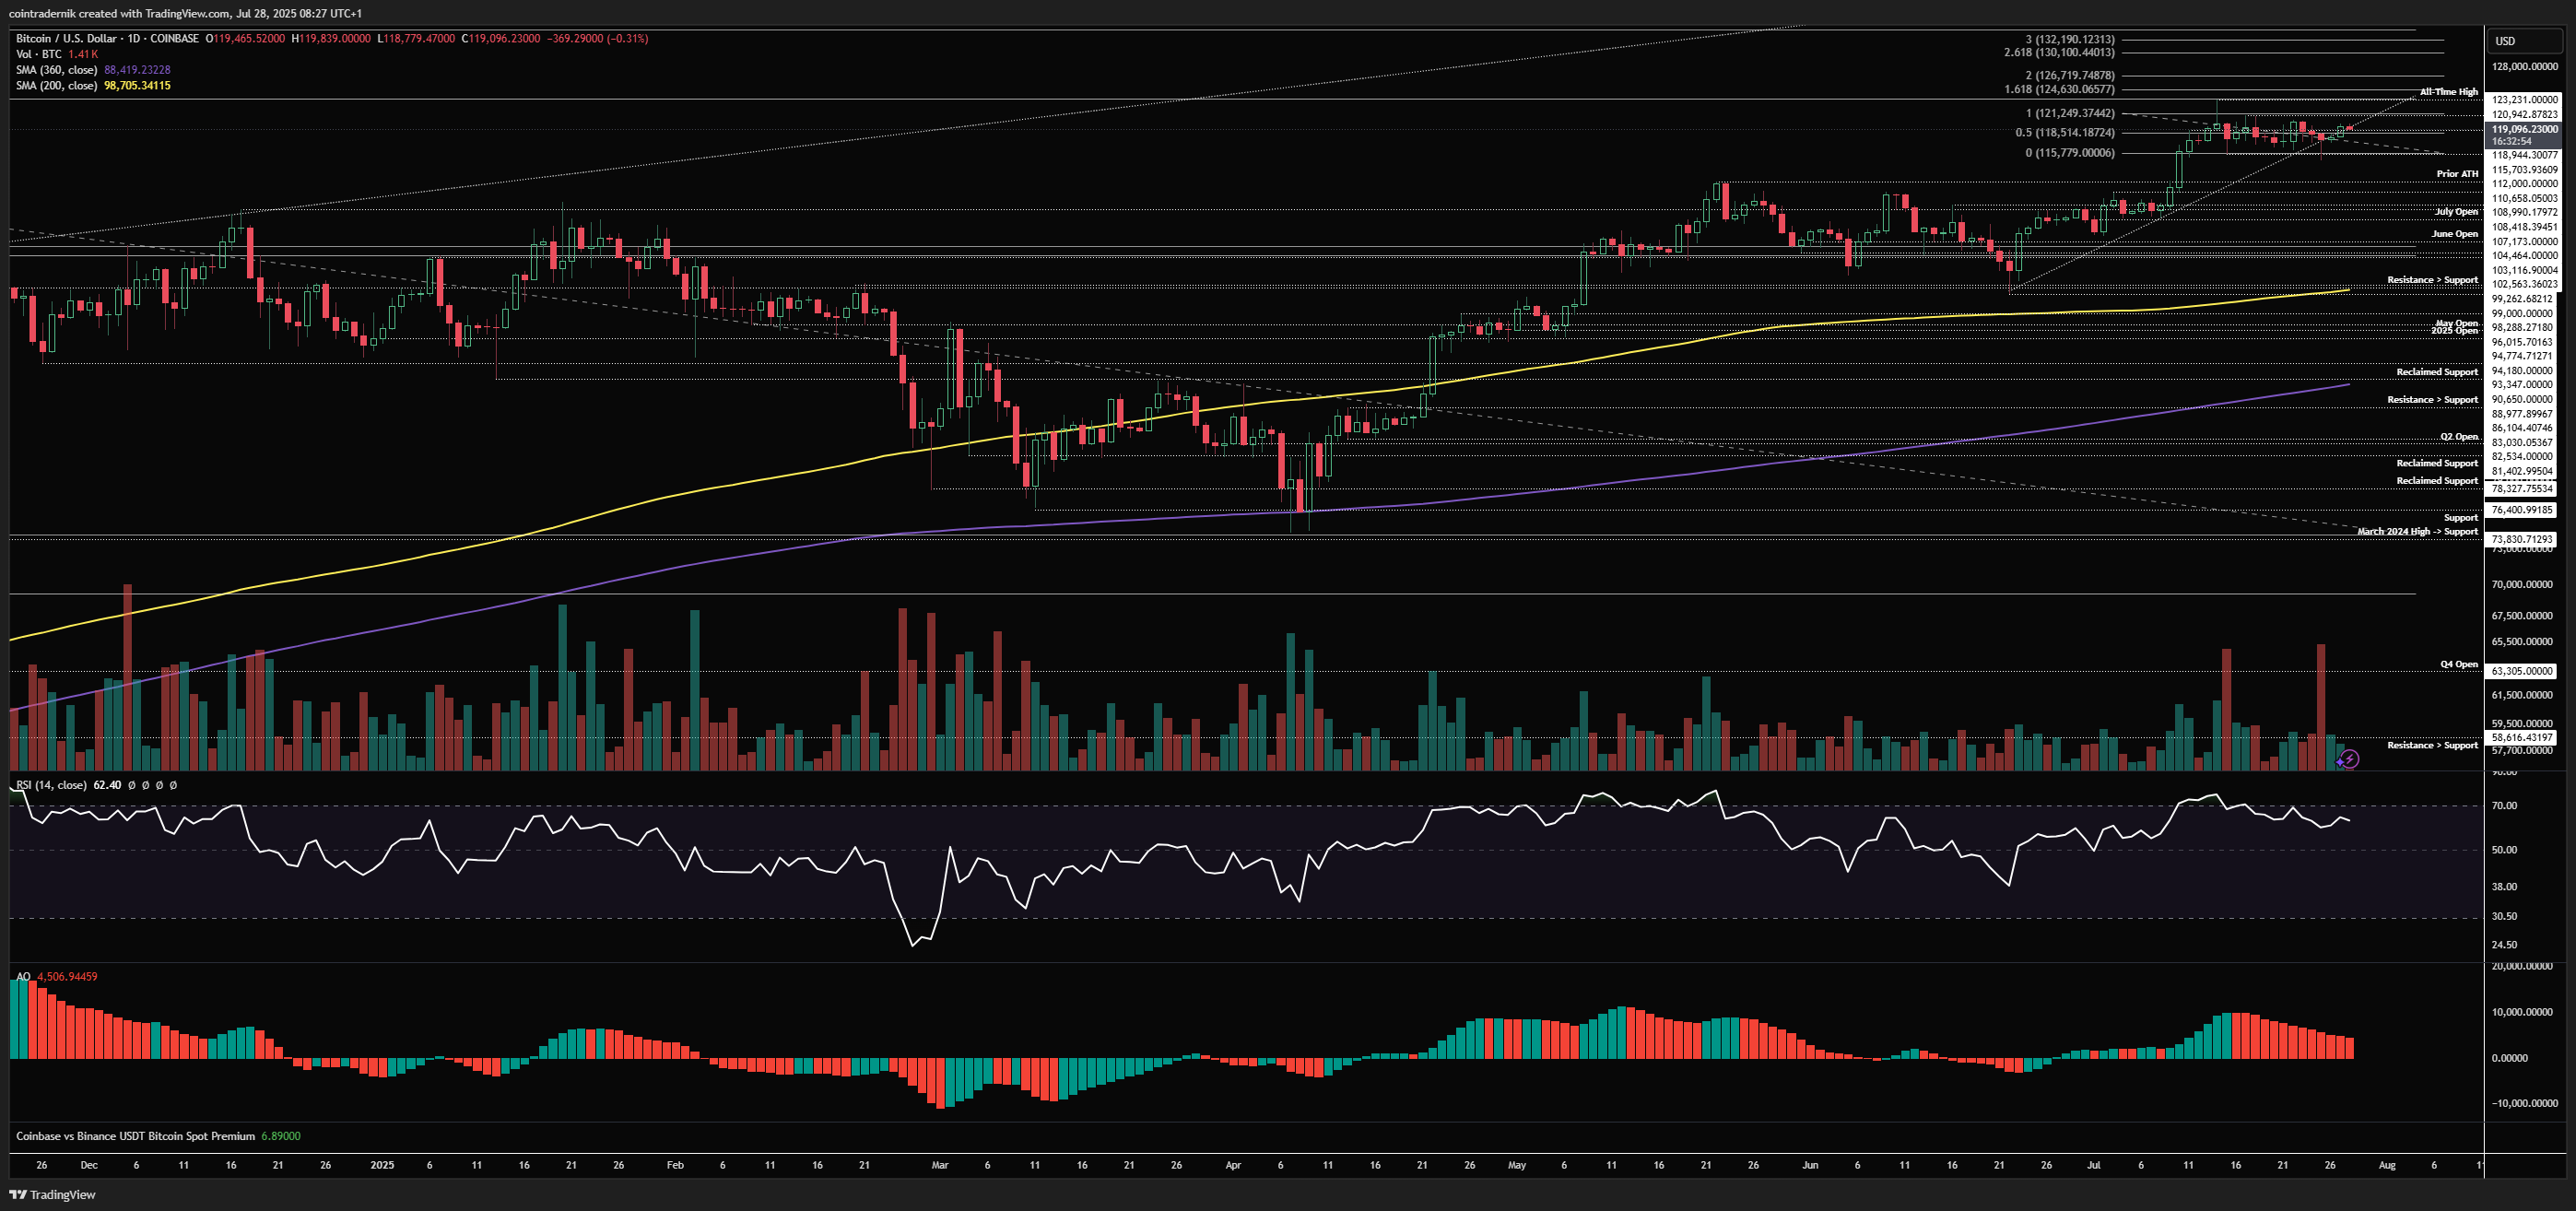
Daily:
Turning to the daily, we can see that price has been in this very flat tight range between $116kish and $121kish for a while now, with daily momentum resetting and price spending most of its time chopping right around mid-range. We need to see a daily close above $121k, flipping that level as support, for price discovery to become the likely path ahead, where $124.6k would be minor resistance above the current all-time high, but ultimately I would expect price to head towards $133k. If we reject below $121k this week and then break and close below $115.7k into early August, I think we retrace the entire breakout and some, pushing below $112k into $110k, perhaps as low as the July open, trapping late shorts into that support who would think this is some protracted deviation rather than a classical breakout retest where we have had plenty of time between the breakout and the retest for it to be a valid buying opportunity. That would then fuel the reversal higher into the more typically strong Q4 period. I've seen a lot of people talking about how Bitcoin always breaks out and then runs without a retest, and whilst an immediate post-breakout retest would be something to be suspicious of, I have zero problems with buying a multi-month resistance level as newfound support ($108k-$110k) if the retest has had plenty of time, which in this case it has (should it come).
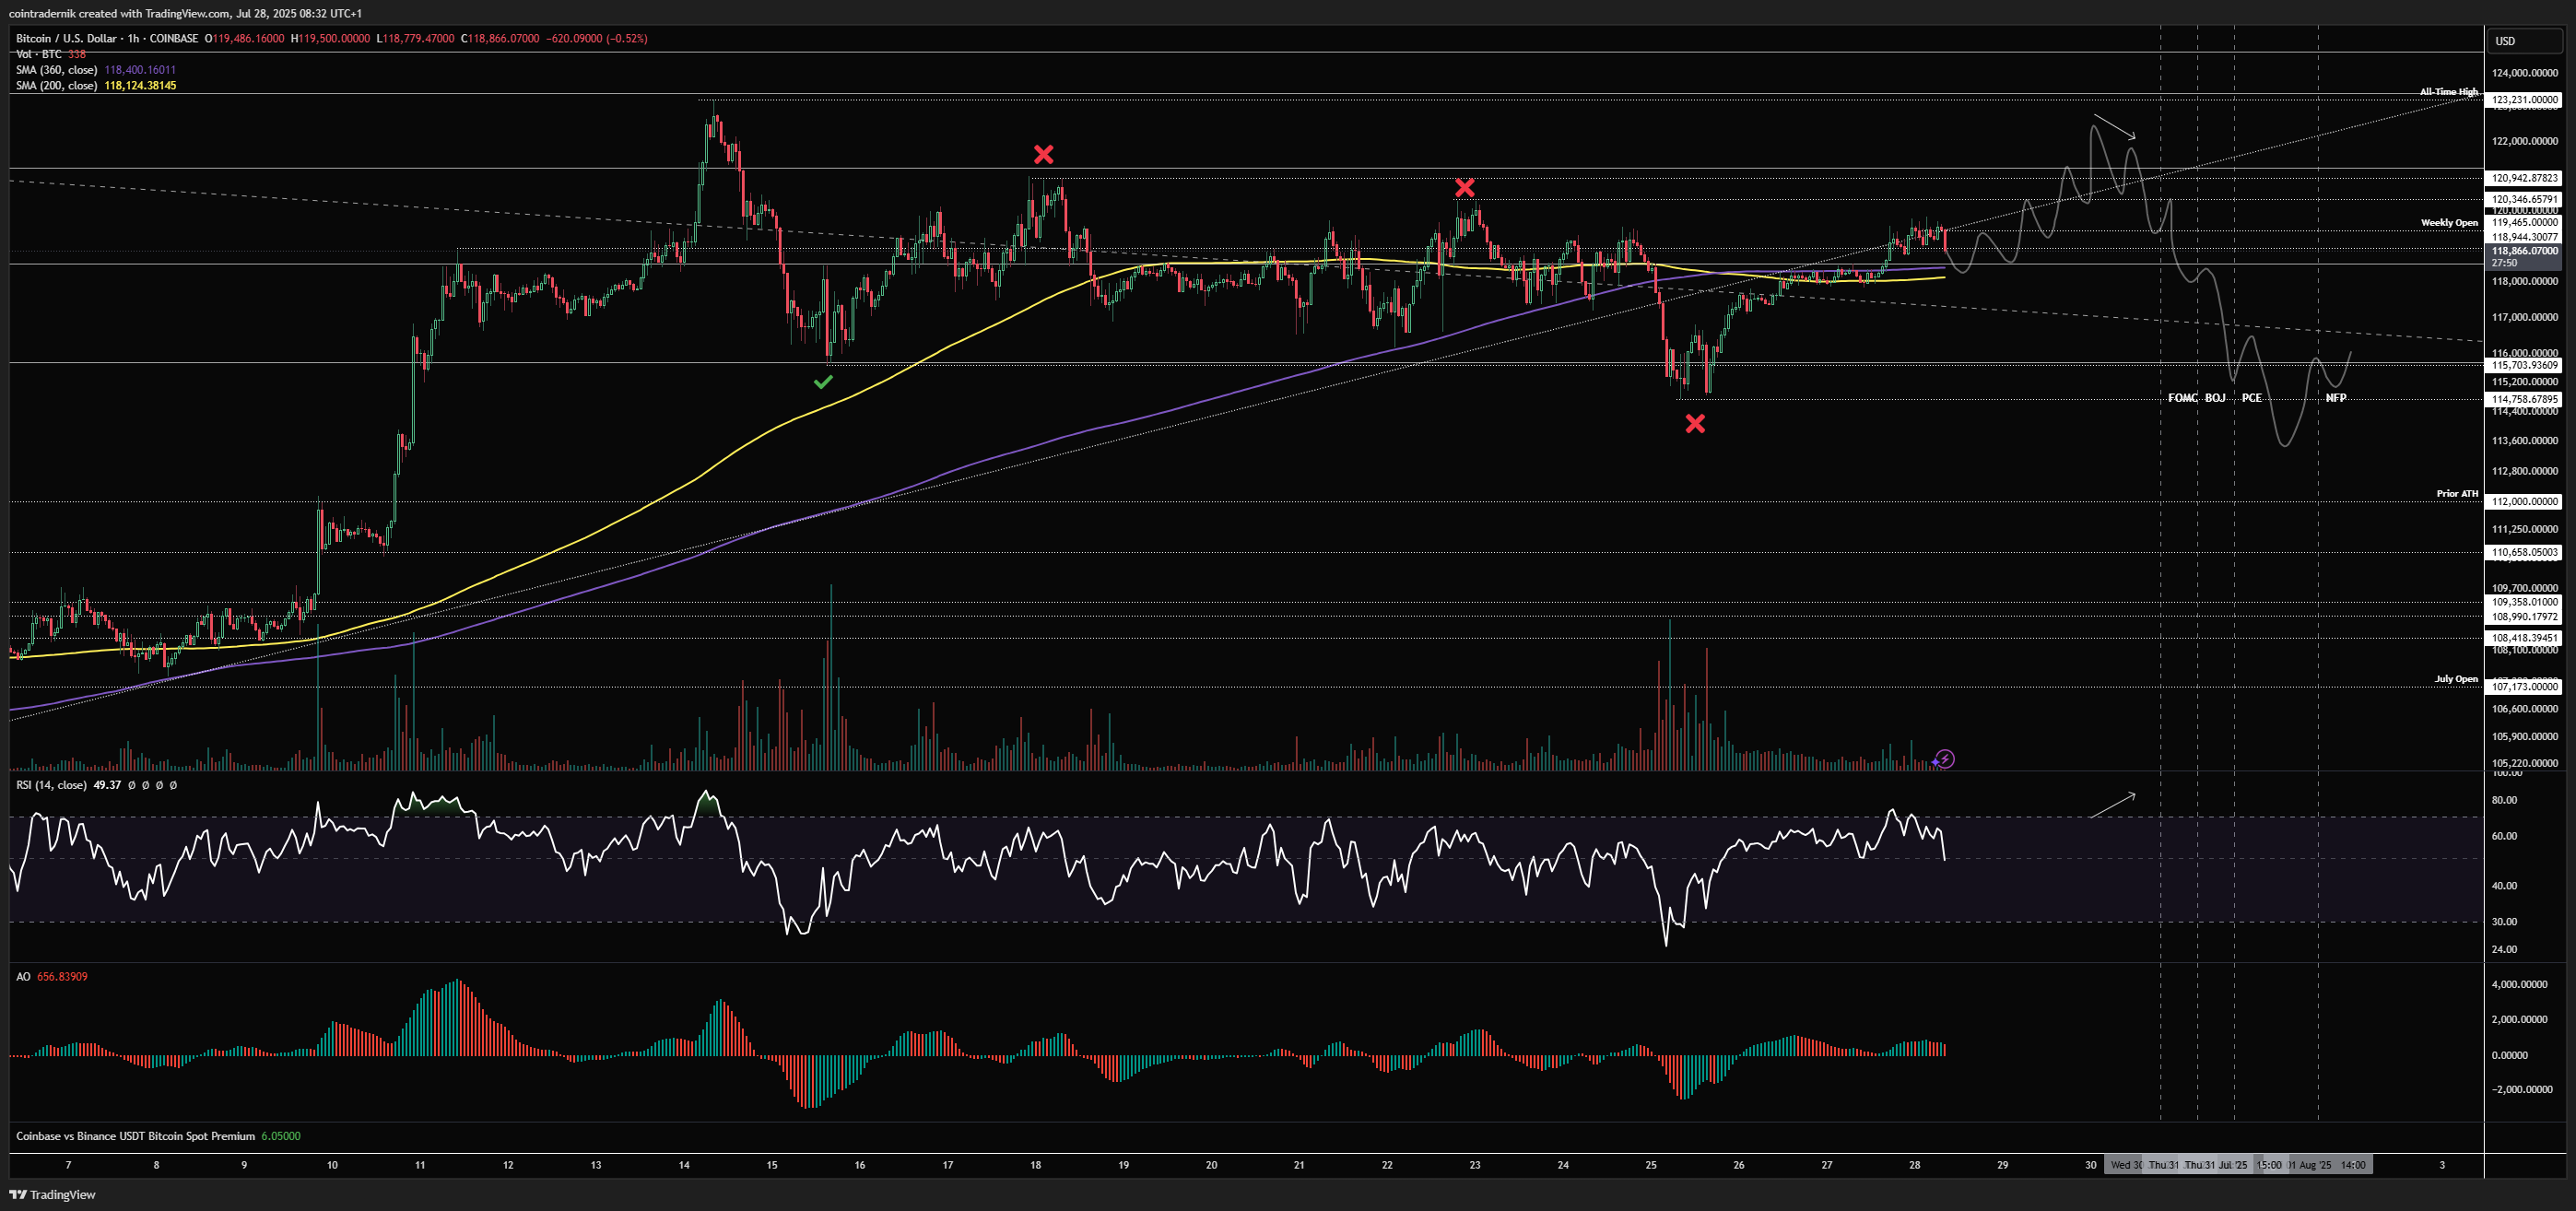
Now, looking at potential setups for the week ahead, as mentioned above it is likely this week is very volatile and thus clean setups do not present themselves, but the premise of derisking into headline risk and then rallying out of that into a strong weekly and monthly close is what we're looking for from a long, where we leave $120.3k untapped and sell off into FOMC, potentially sweeping $114.7k but not necessarily, and then look to buy lower timeframe exhaustion into support as we head into the back-end of the week:
On the short side, you really want to see price pump hard early this week and take out multiple highs towards all-time highs before FOMC, then look for bearish divergence and fade that as price breaks lower with a view to trading into $115.7k support at least into NFPs:
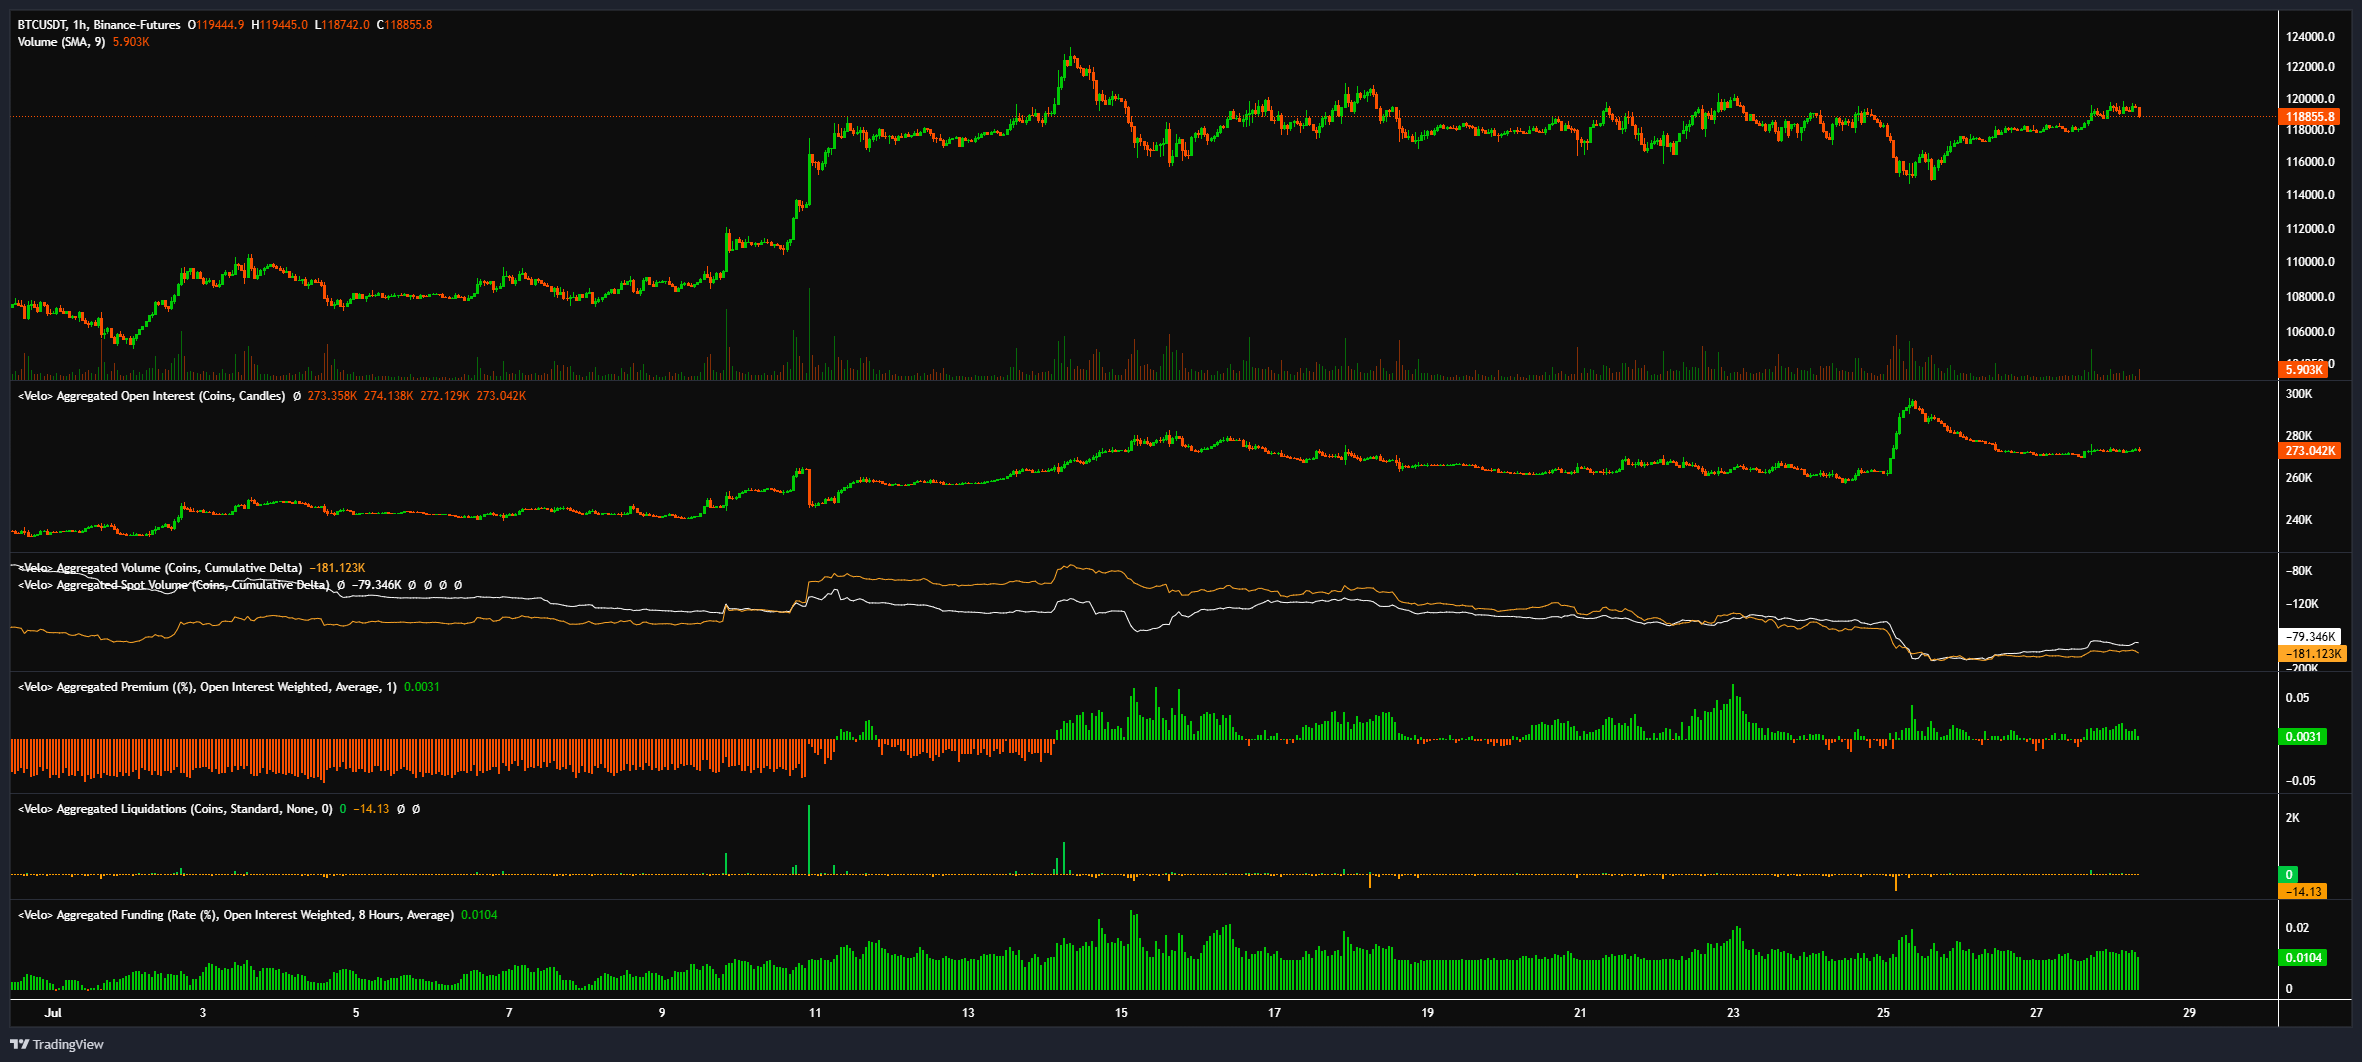
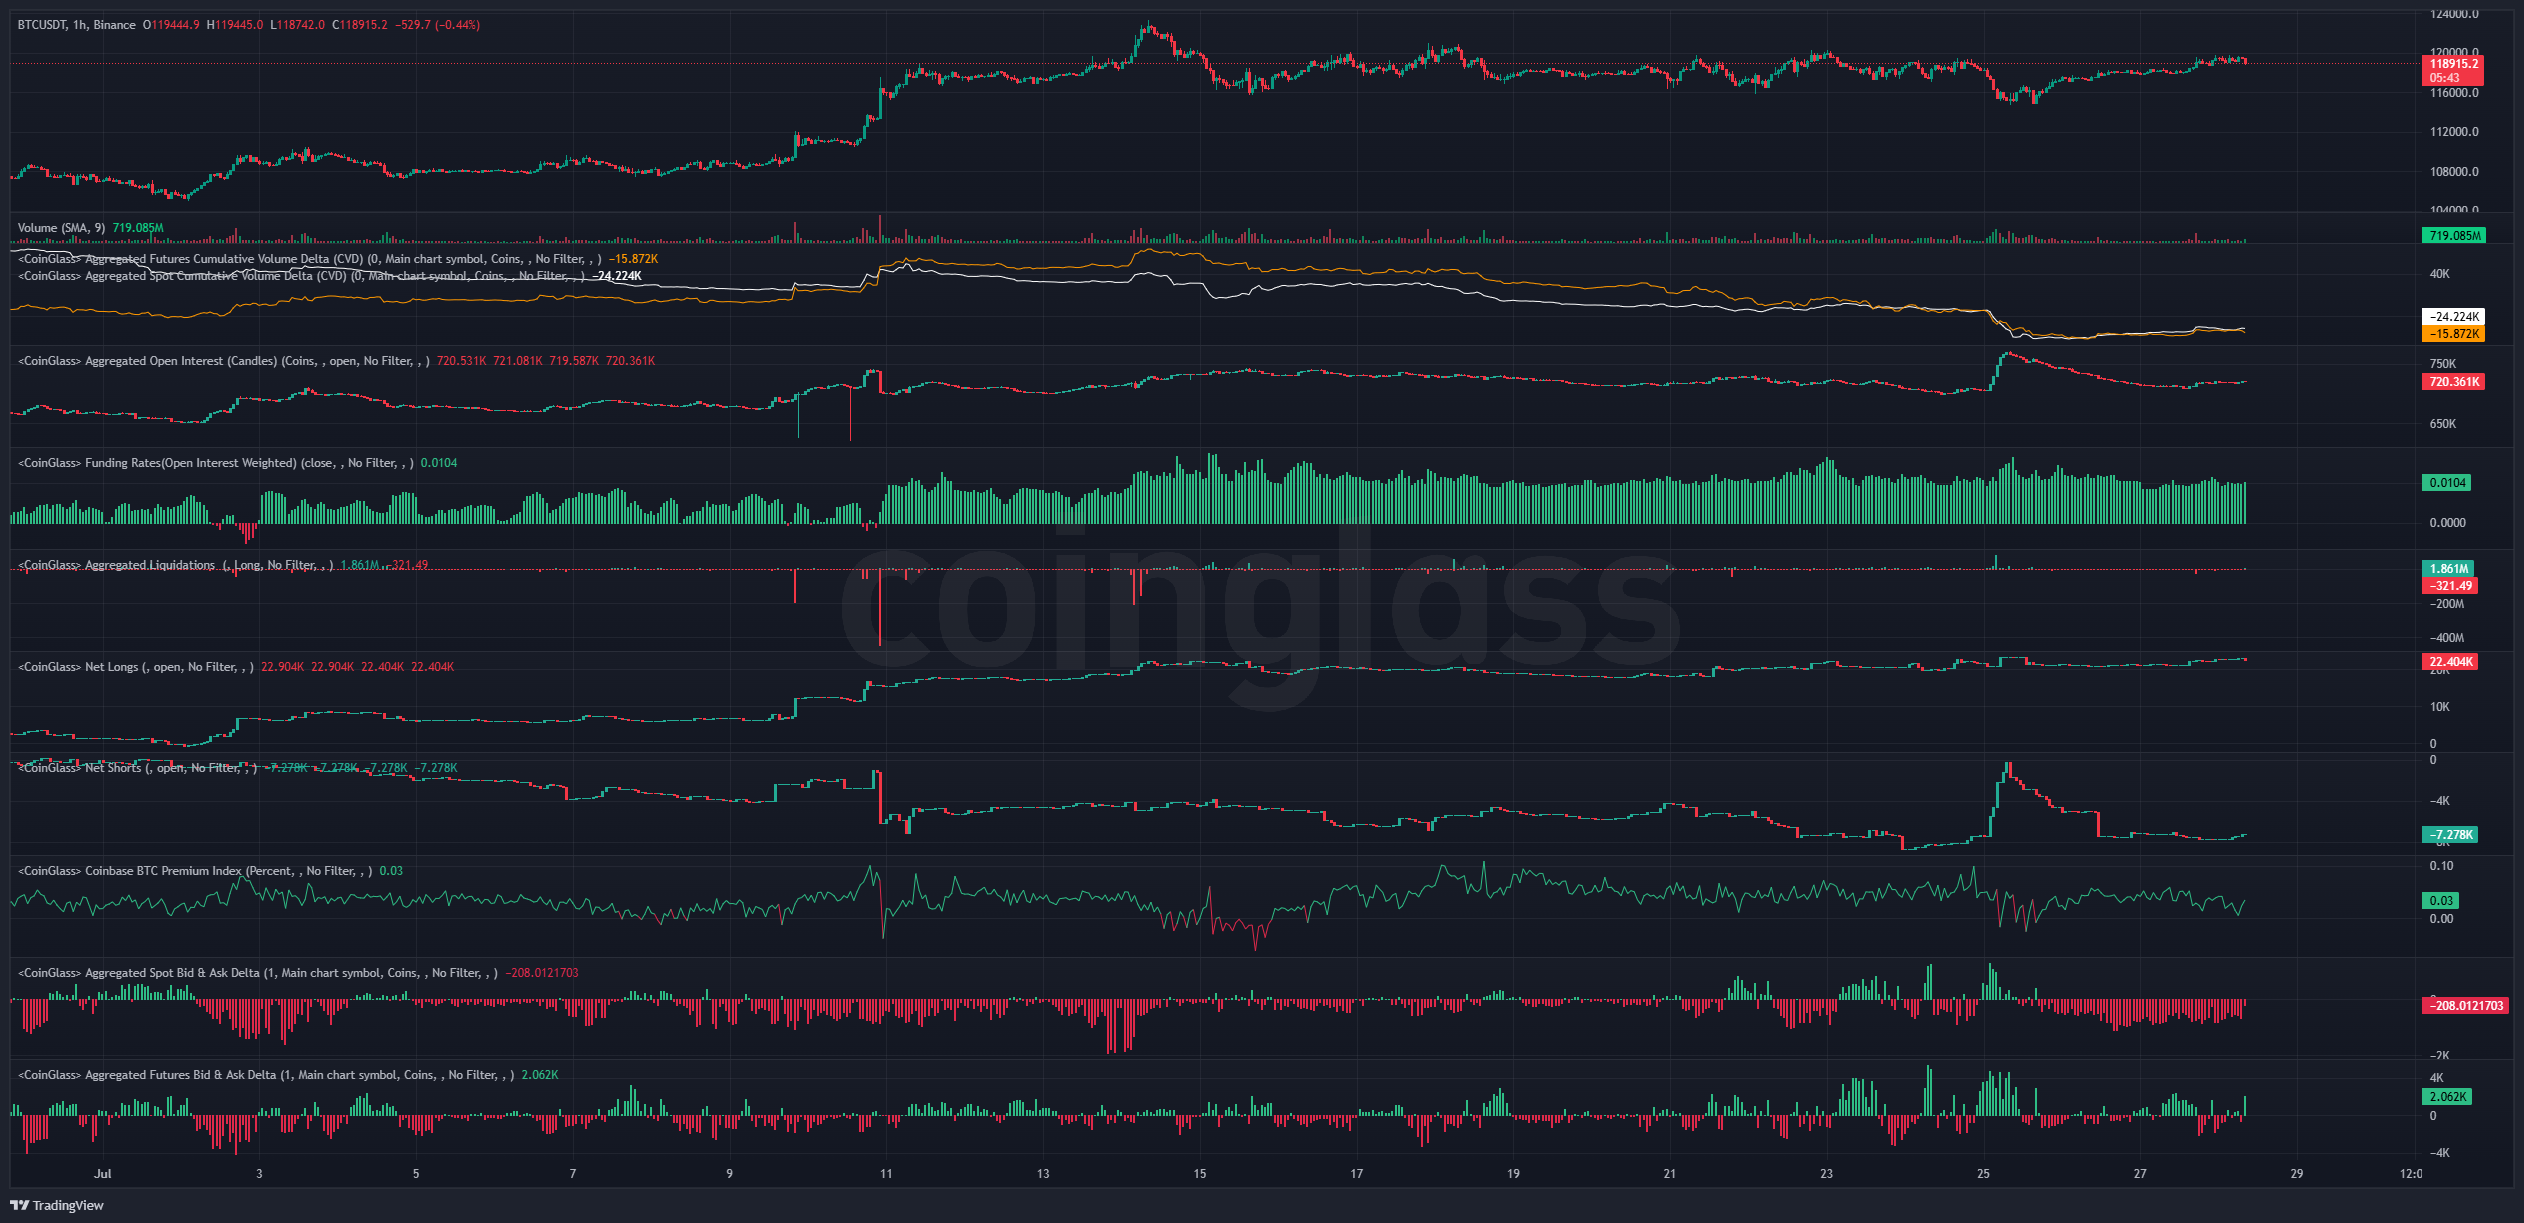
And here's a snapshot of positioning across Velo and CoinGlass:
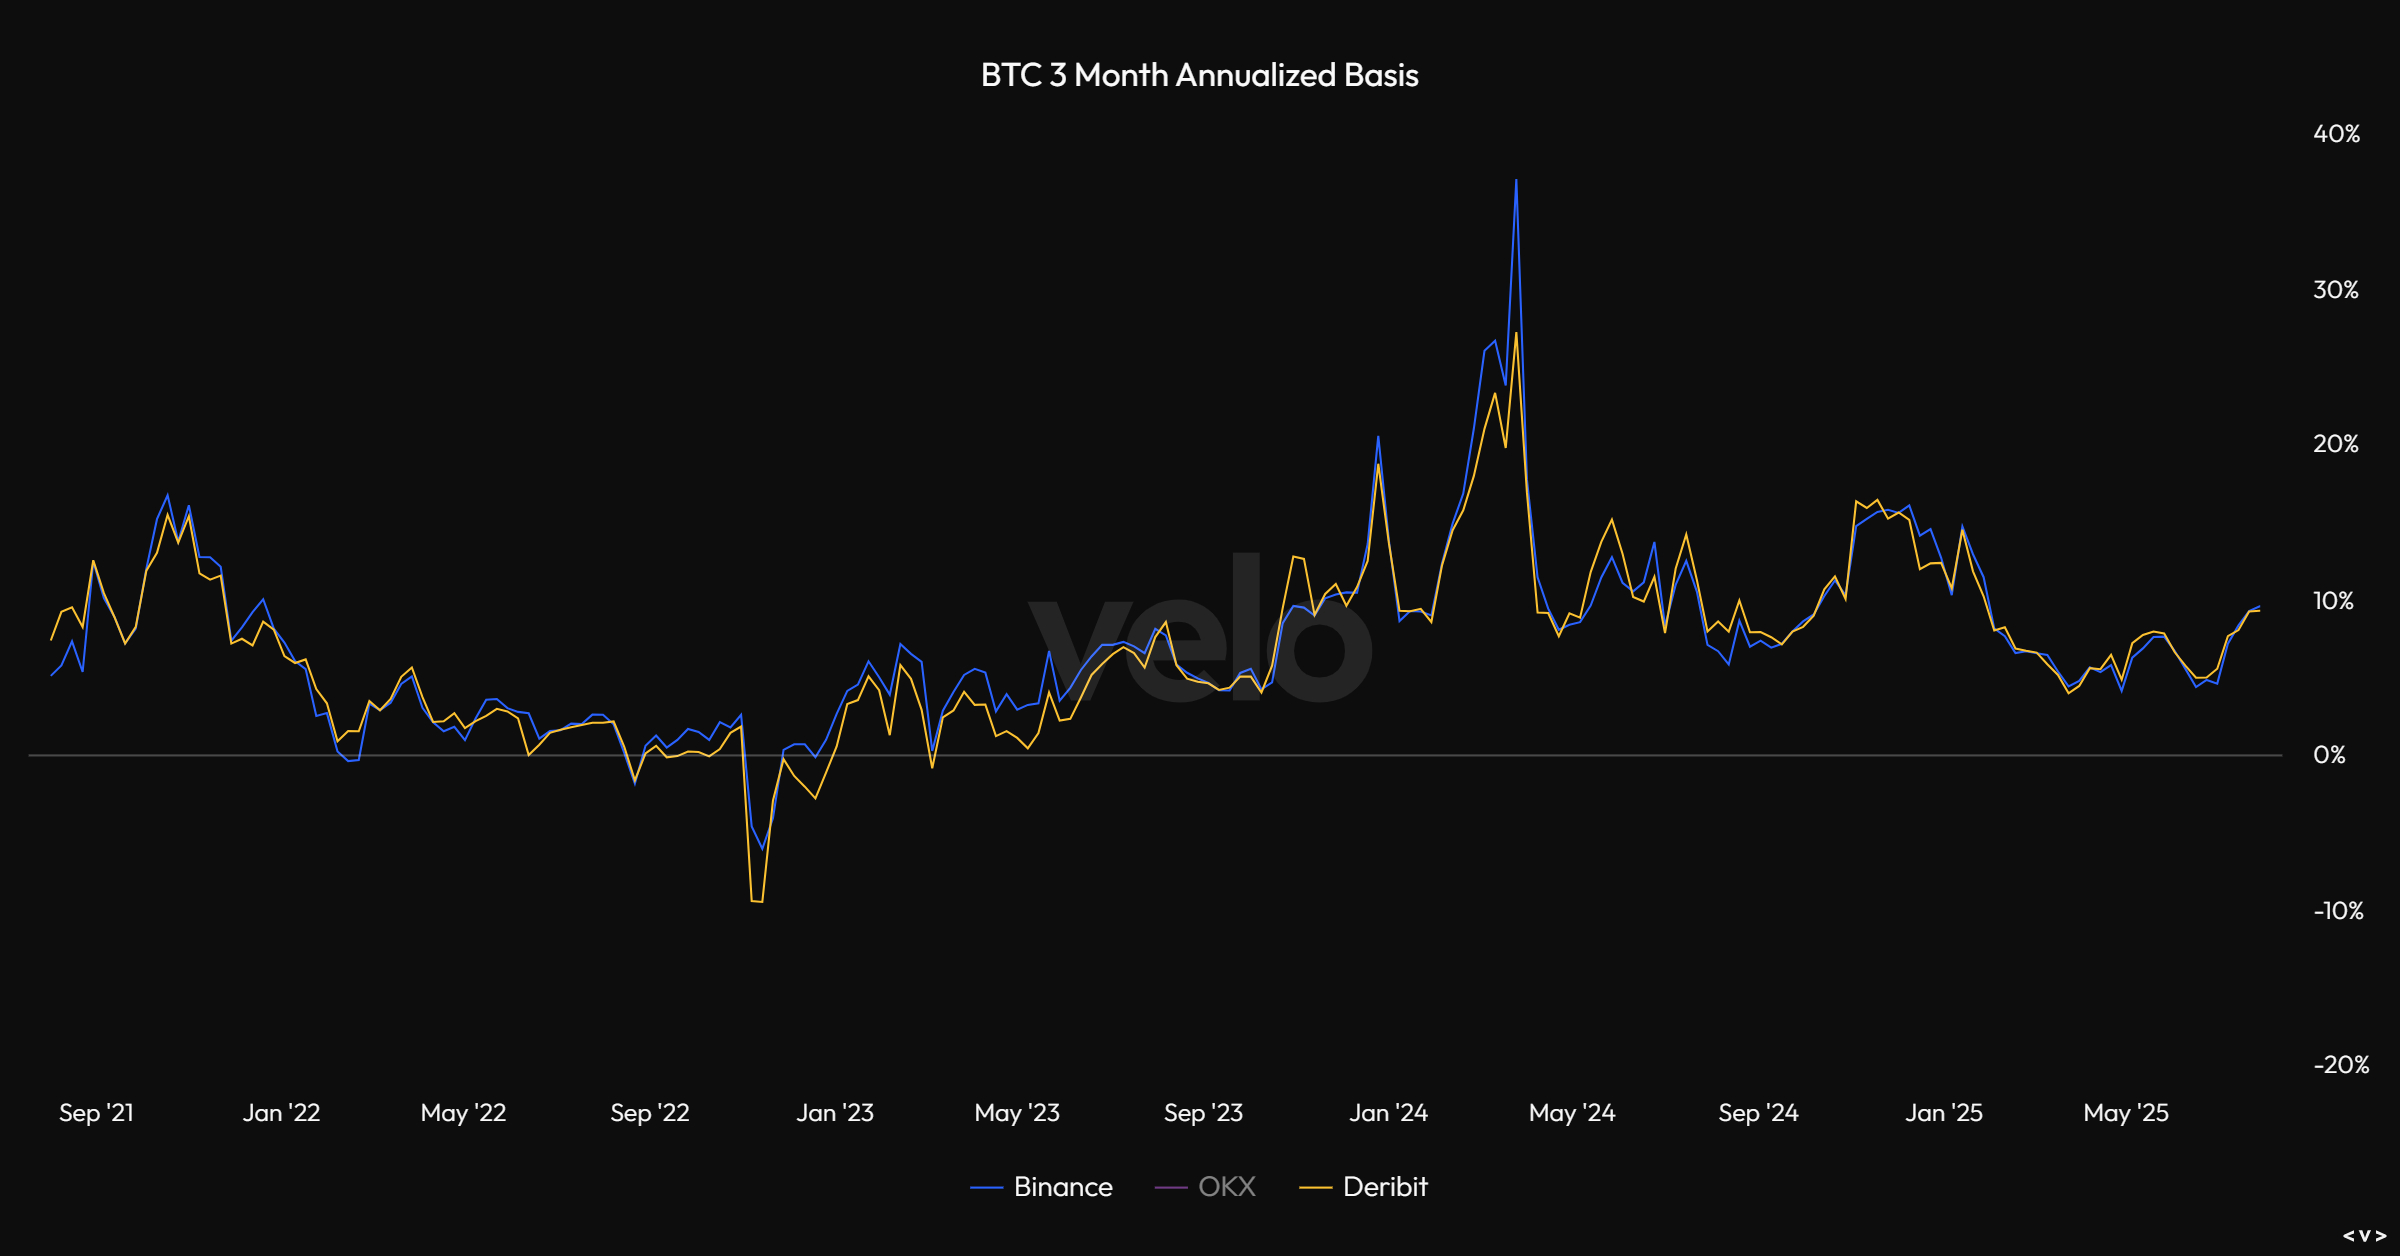
And here's 3-month annualized basis:
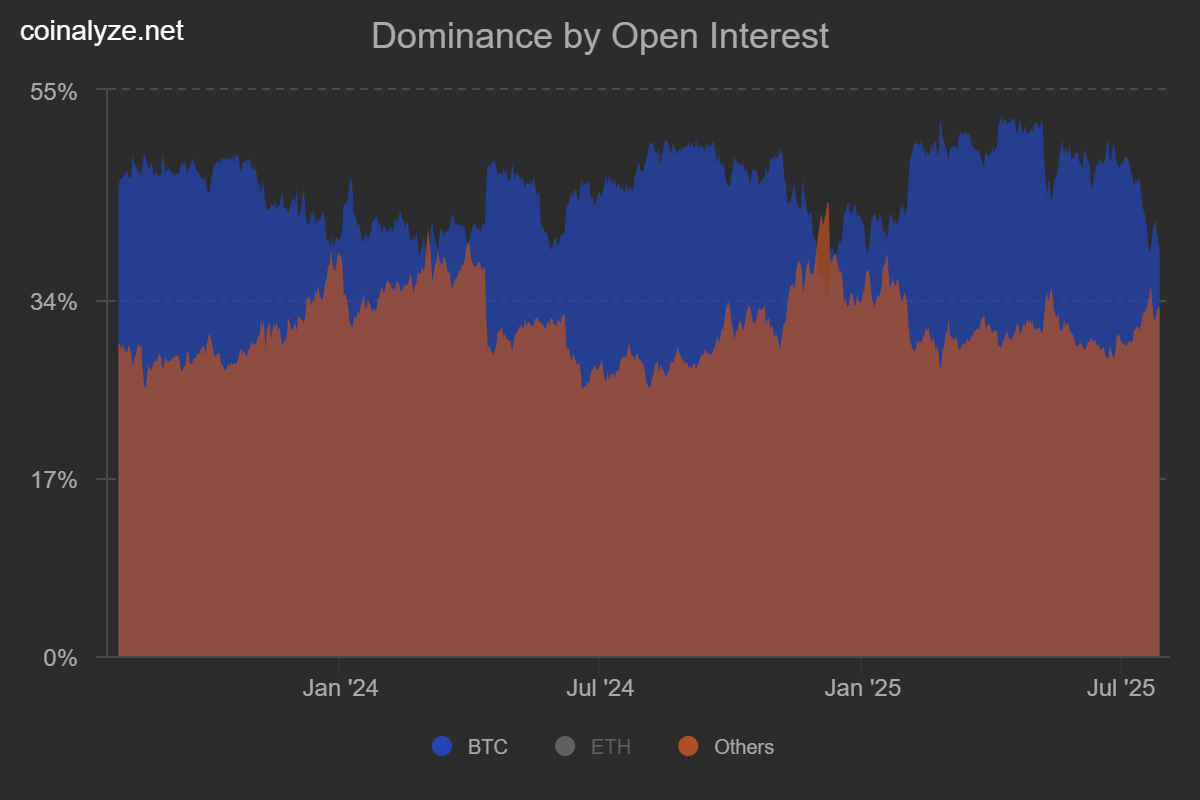
And Bitcoin OI vs Altcoin OI:
And finally some of the expected 1-week and 1-month liquidation levels:
Ethereum:
Price: $3890
ETH/USD
Weekly:
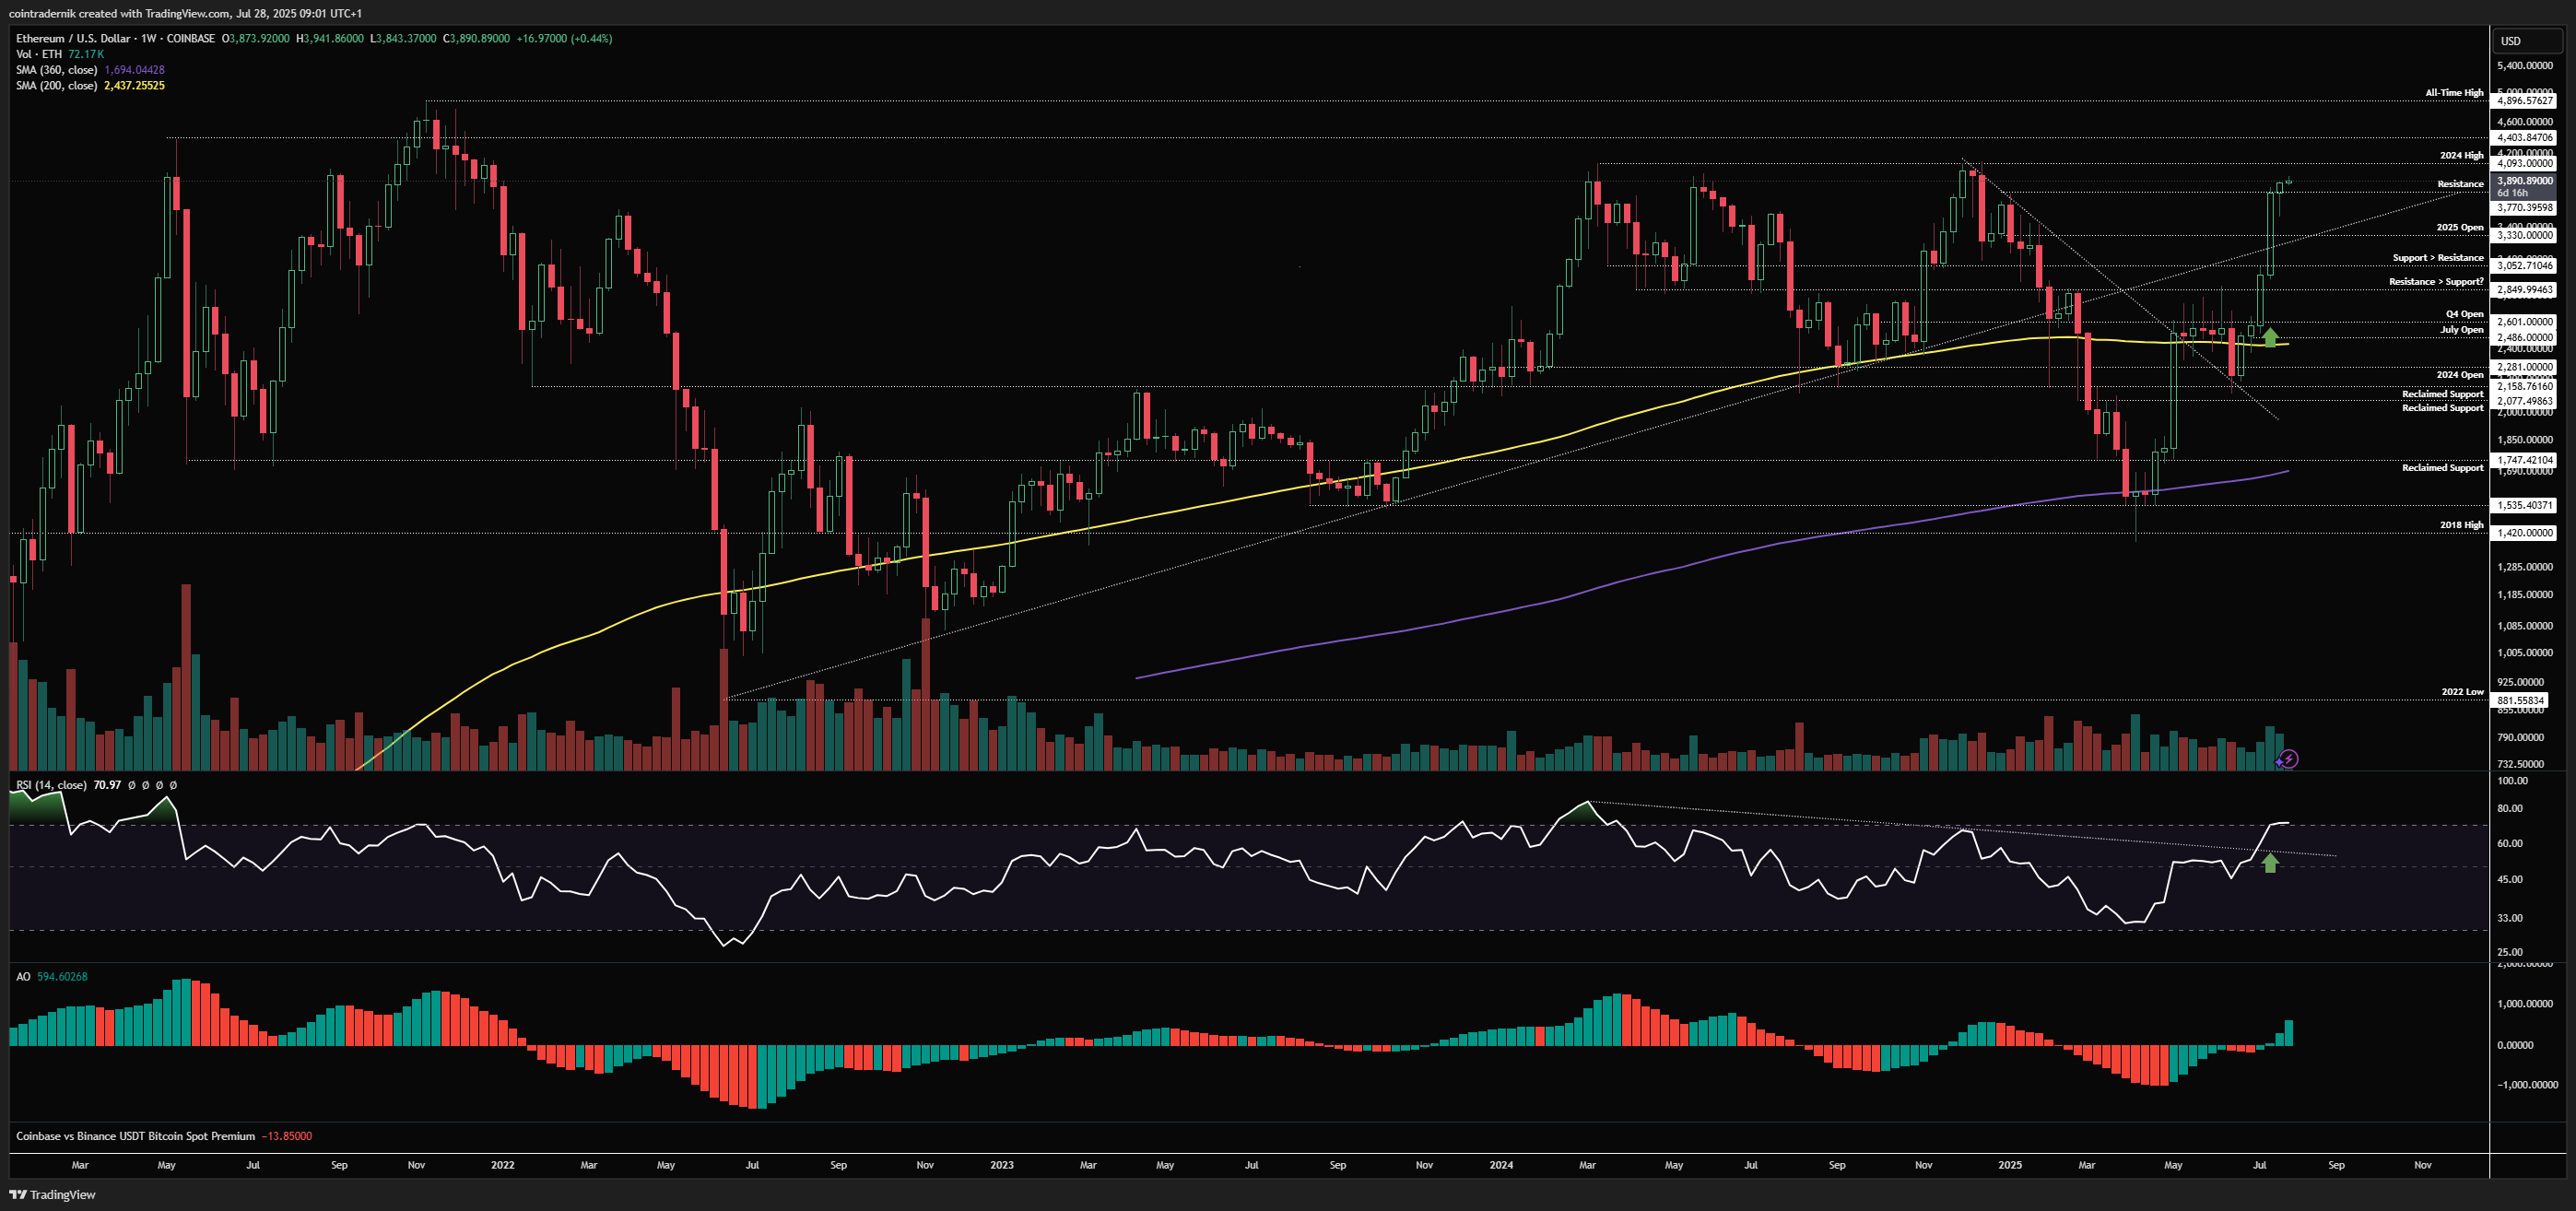
Beginning with the weekly for ETH/USD, after the monster expansion the prior week, last week saw price wick marginally lower and find demand, then bouncing back above the previous weekly high to close through $3770 resistance into $3873, with only the 2024 highs and multi-year resistance at $4093 in the way. We have a clear momentum breakout on this timeframe and I would expect to see this squeeze continue at least into that huge resistance cluster over the next week or two, where we may take a breather before the eventual breakout. Closing the weekly back below $3770 here would negate this short-term view and would open up a retest of the 2025 open at $3330 in early August to form a higher-low before the attempt at $4xxx.
Daily:
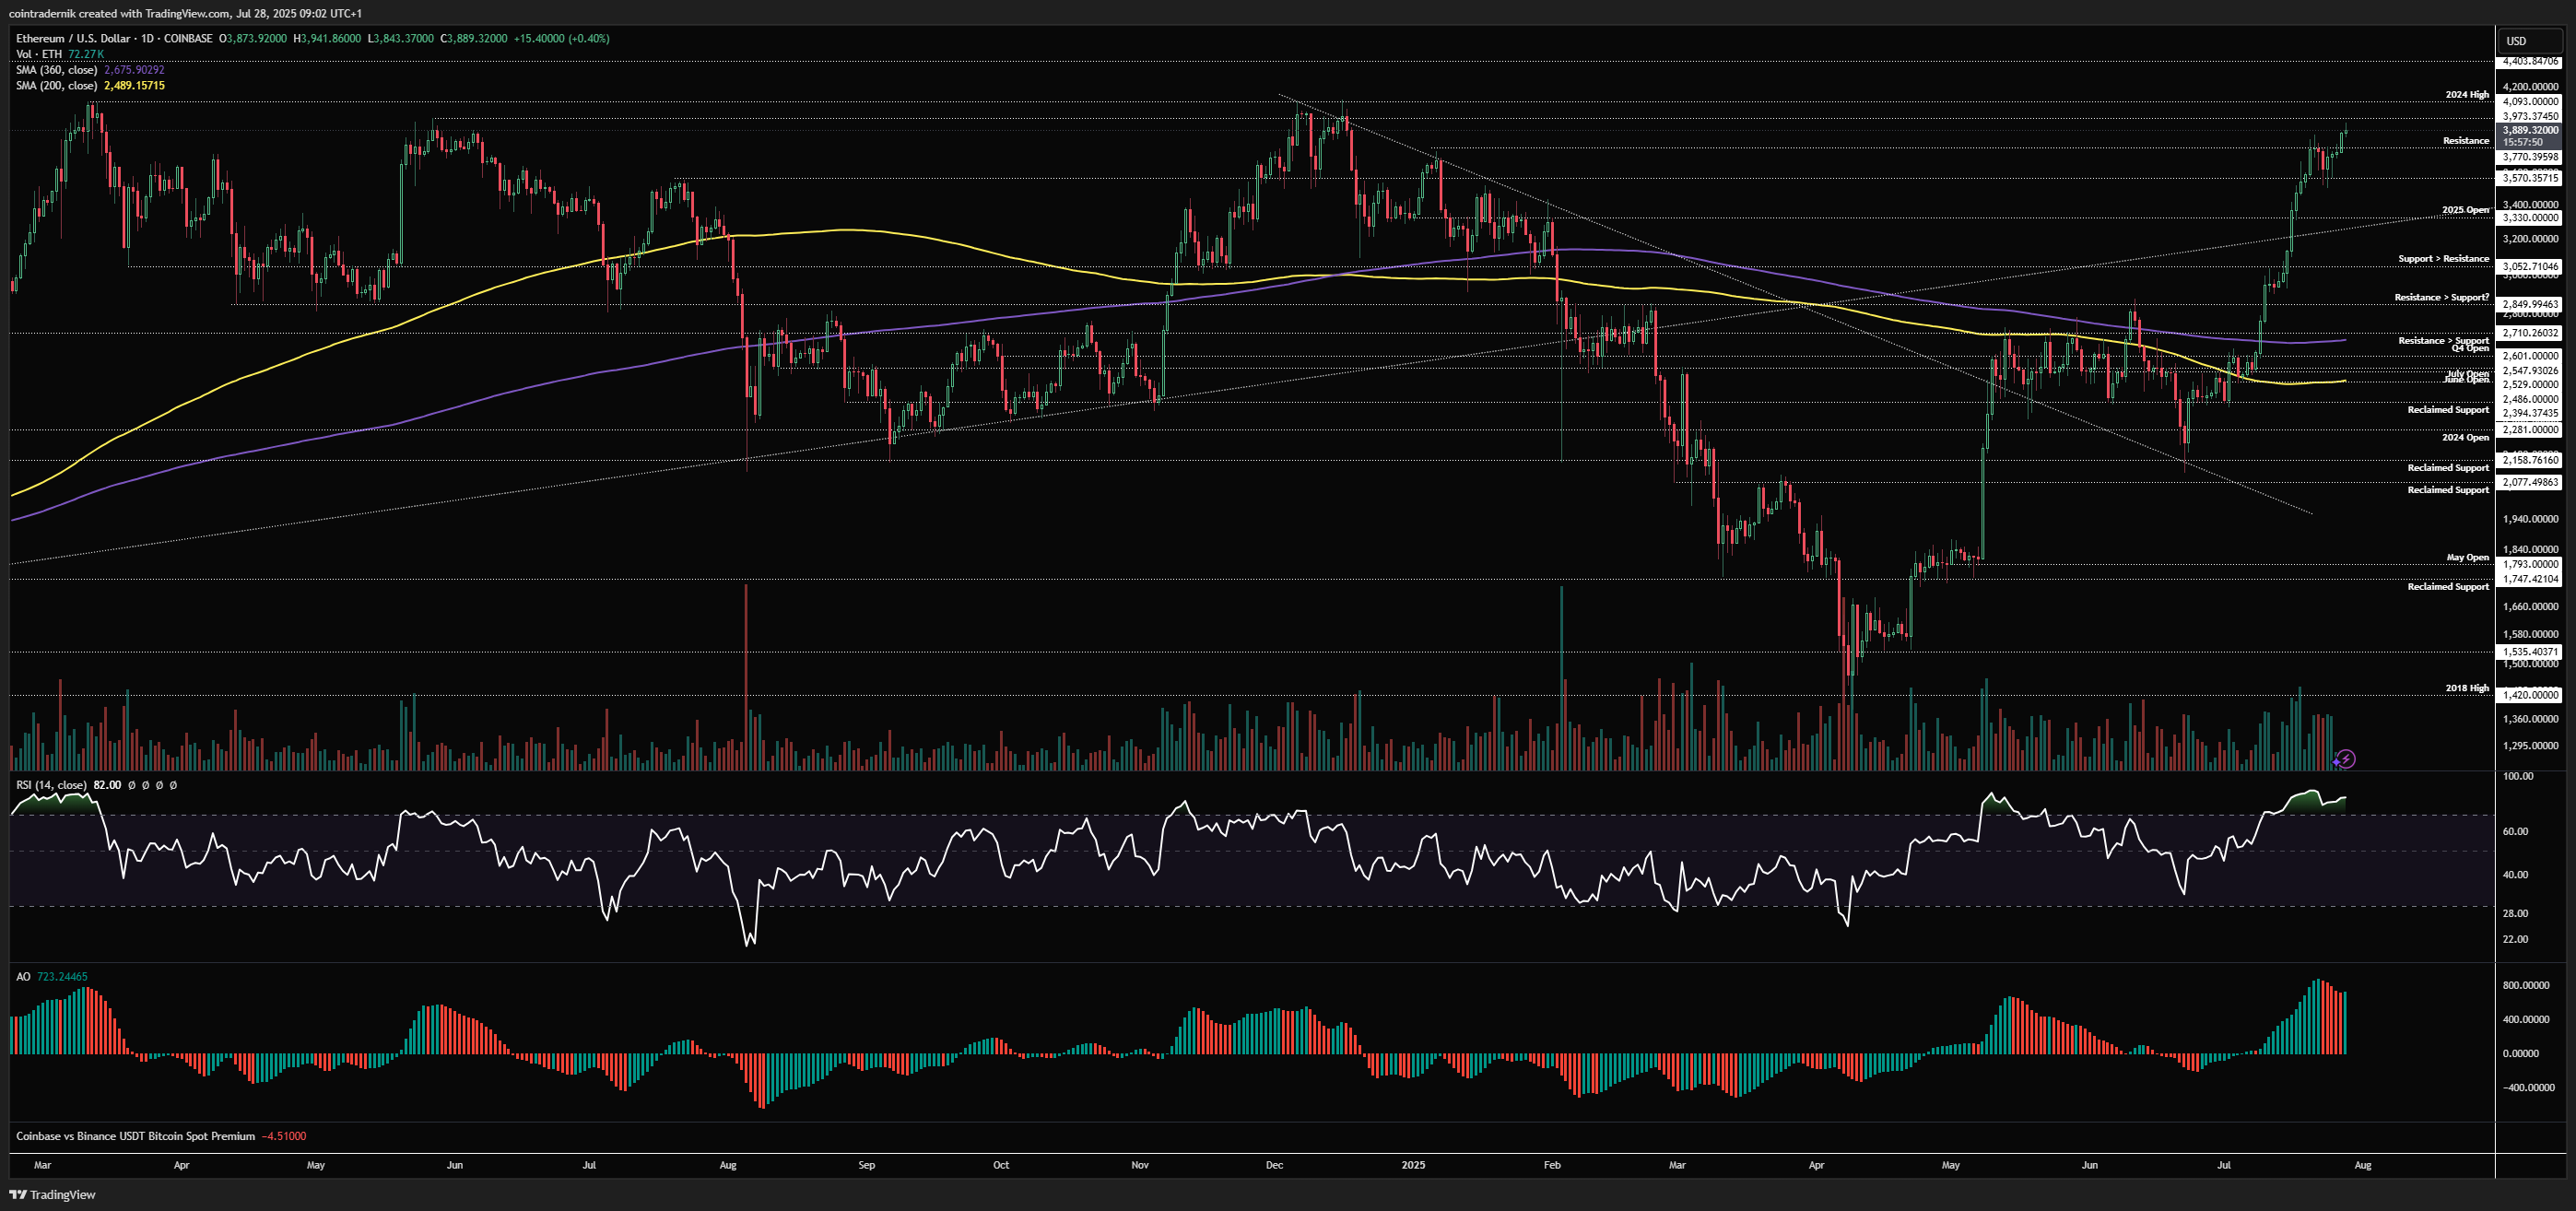
On the daily timeframe, we can see that price broke beyond last week's high, closing above it on the weekend and squeezing a little higher earlier this week. There is every chance that this early push during a volatile week is a liquidity grab, in which case we should reject and close back below $3770 going into FOMC, where holding below that level leads to $3570 being swept into the end of the week and further downside from there. If this does not happen, and instead price continues to push higher towards $4093 into Friday, we could then see a local top formation with some bearish divergence, where any pull-back in early August then marks the monthly low and that divergence gets invalidated on the breakout beyond $4100. Right now, structure is very much bullish but it is a long week ahead with many minefields. Let's see how things unfold into early August...
ETH/BTC
Weekly:
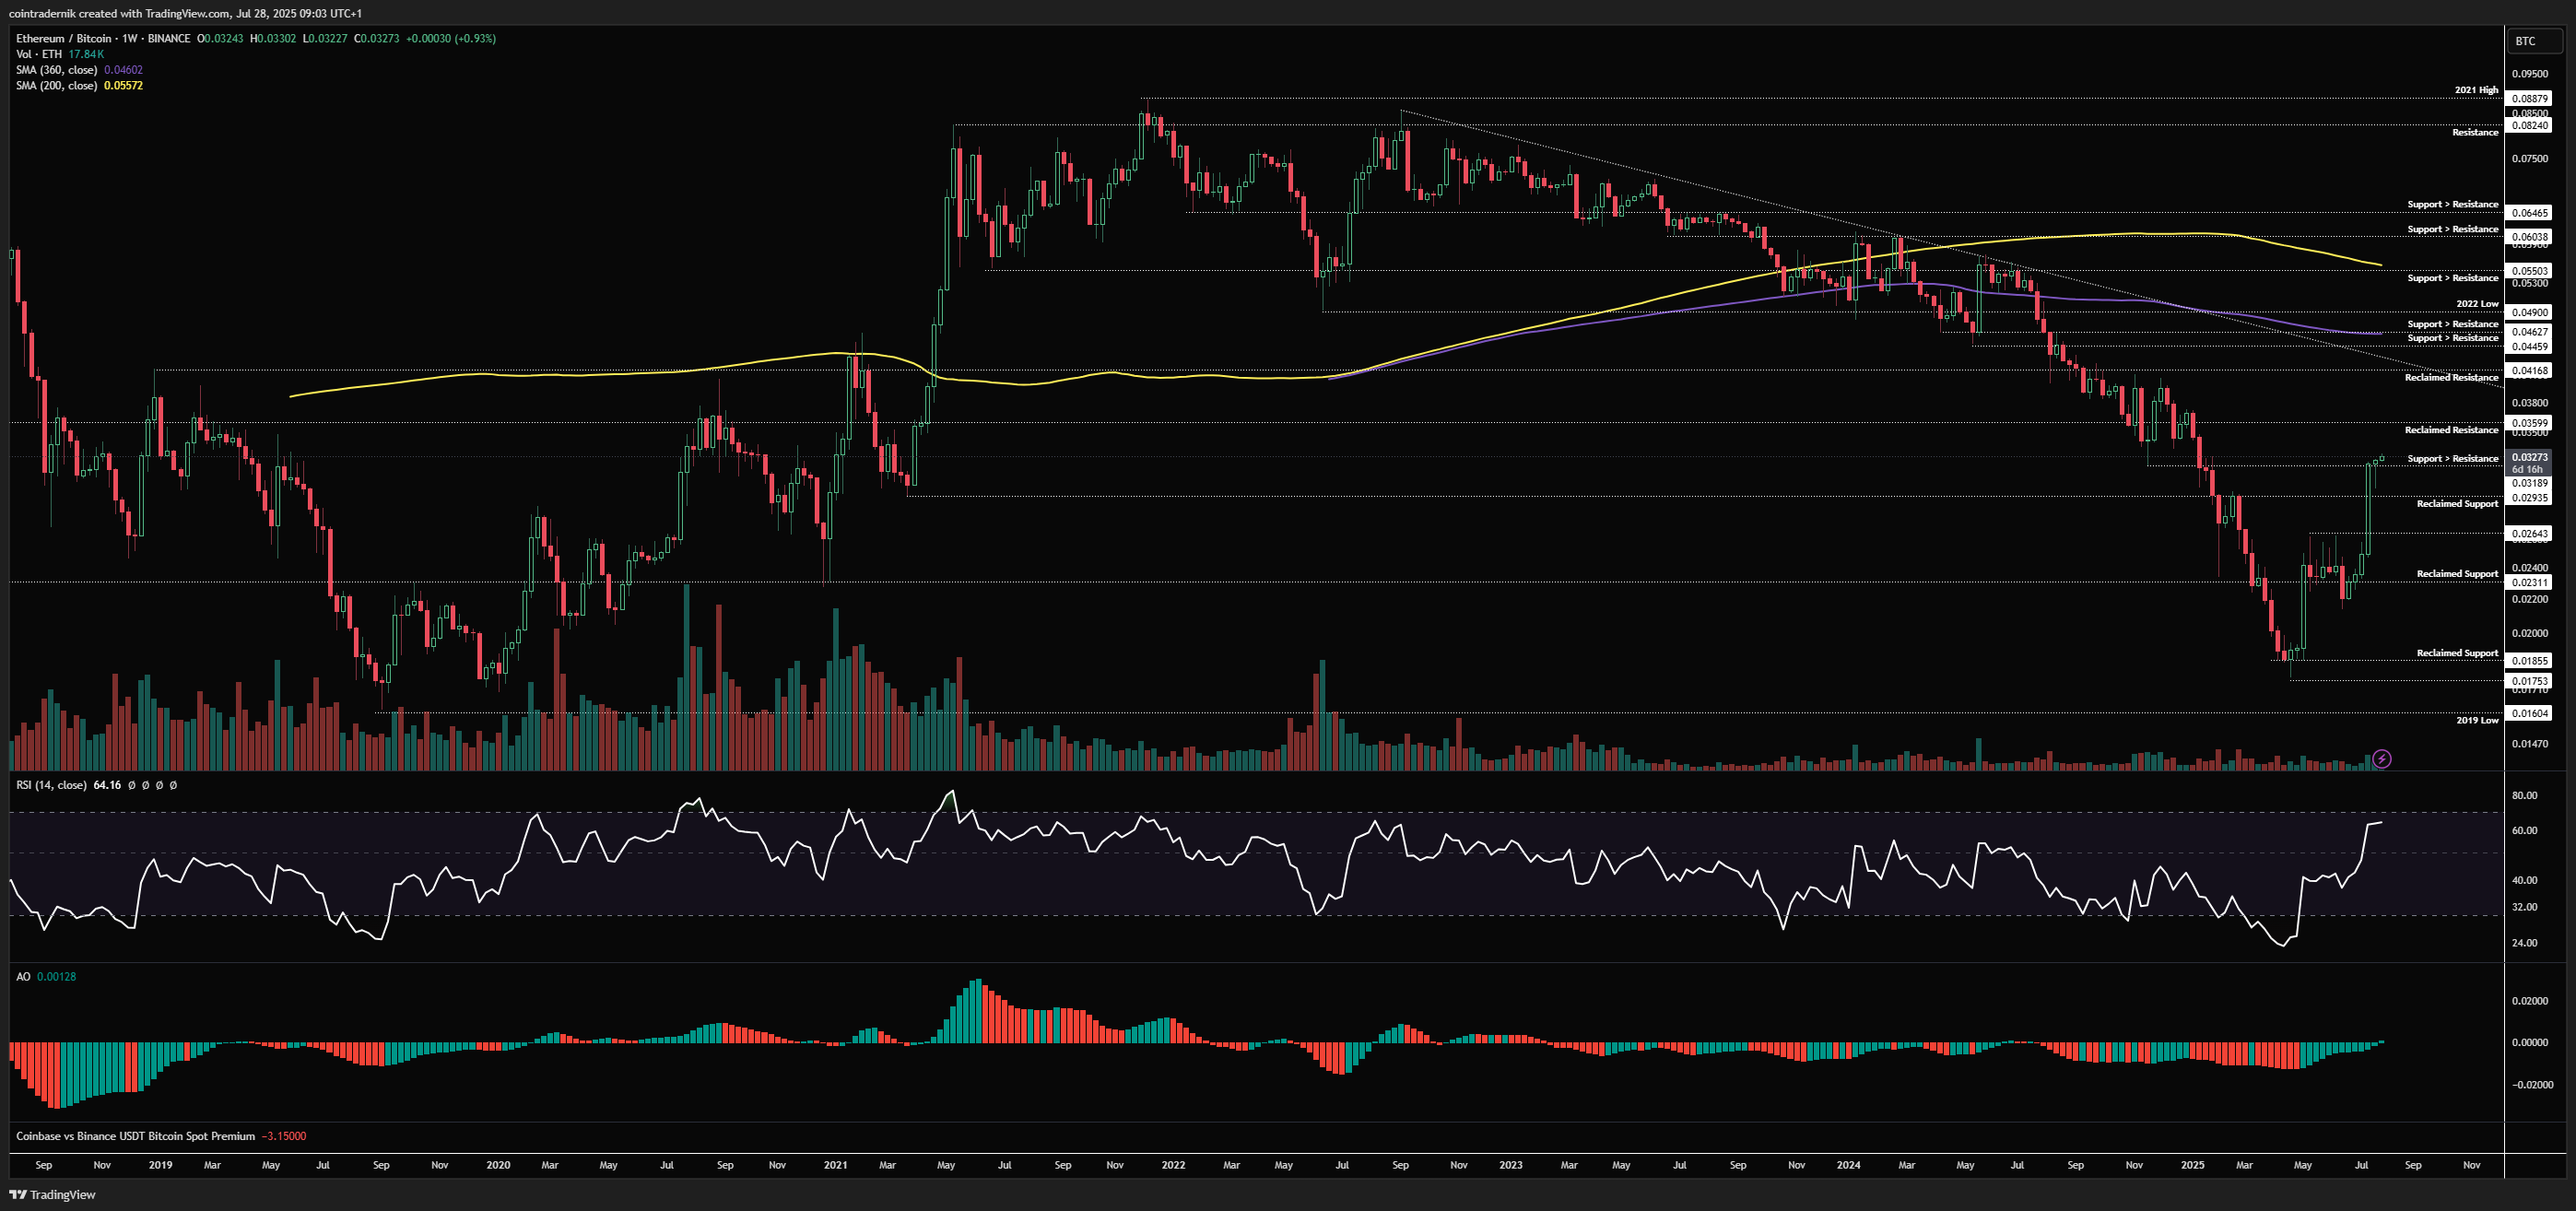
ETH/BTC continues to look bullish after last week saw price find support above 0.0294 and push to weekly highs through 0.032. We should see price continue to push towards 0.036 from here if 0.032 does not give way this week; if it does give way, I think we retest 0.0294 into early August. Only a weekly close back below 0.0294 begins to look more bearish for the coming weeks, where we should then expect a much deeper pull-back to retest 0.0265 as resistance turned support, but I am not currently giving much weight to that scenario to be honest. Acceptance above 0.036 = 0.0417, which has been the major target for this move since the 0.0175 low.
Daily:
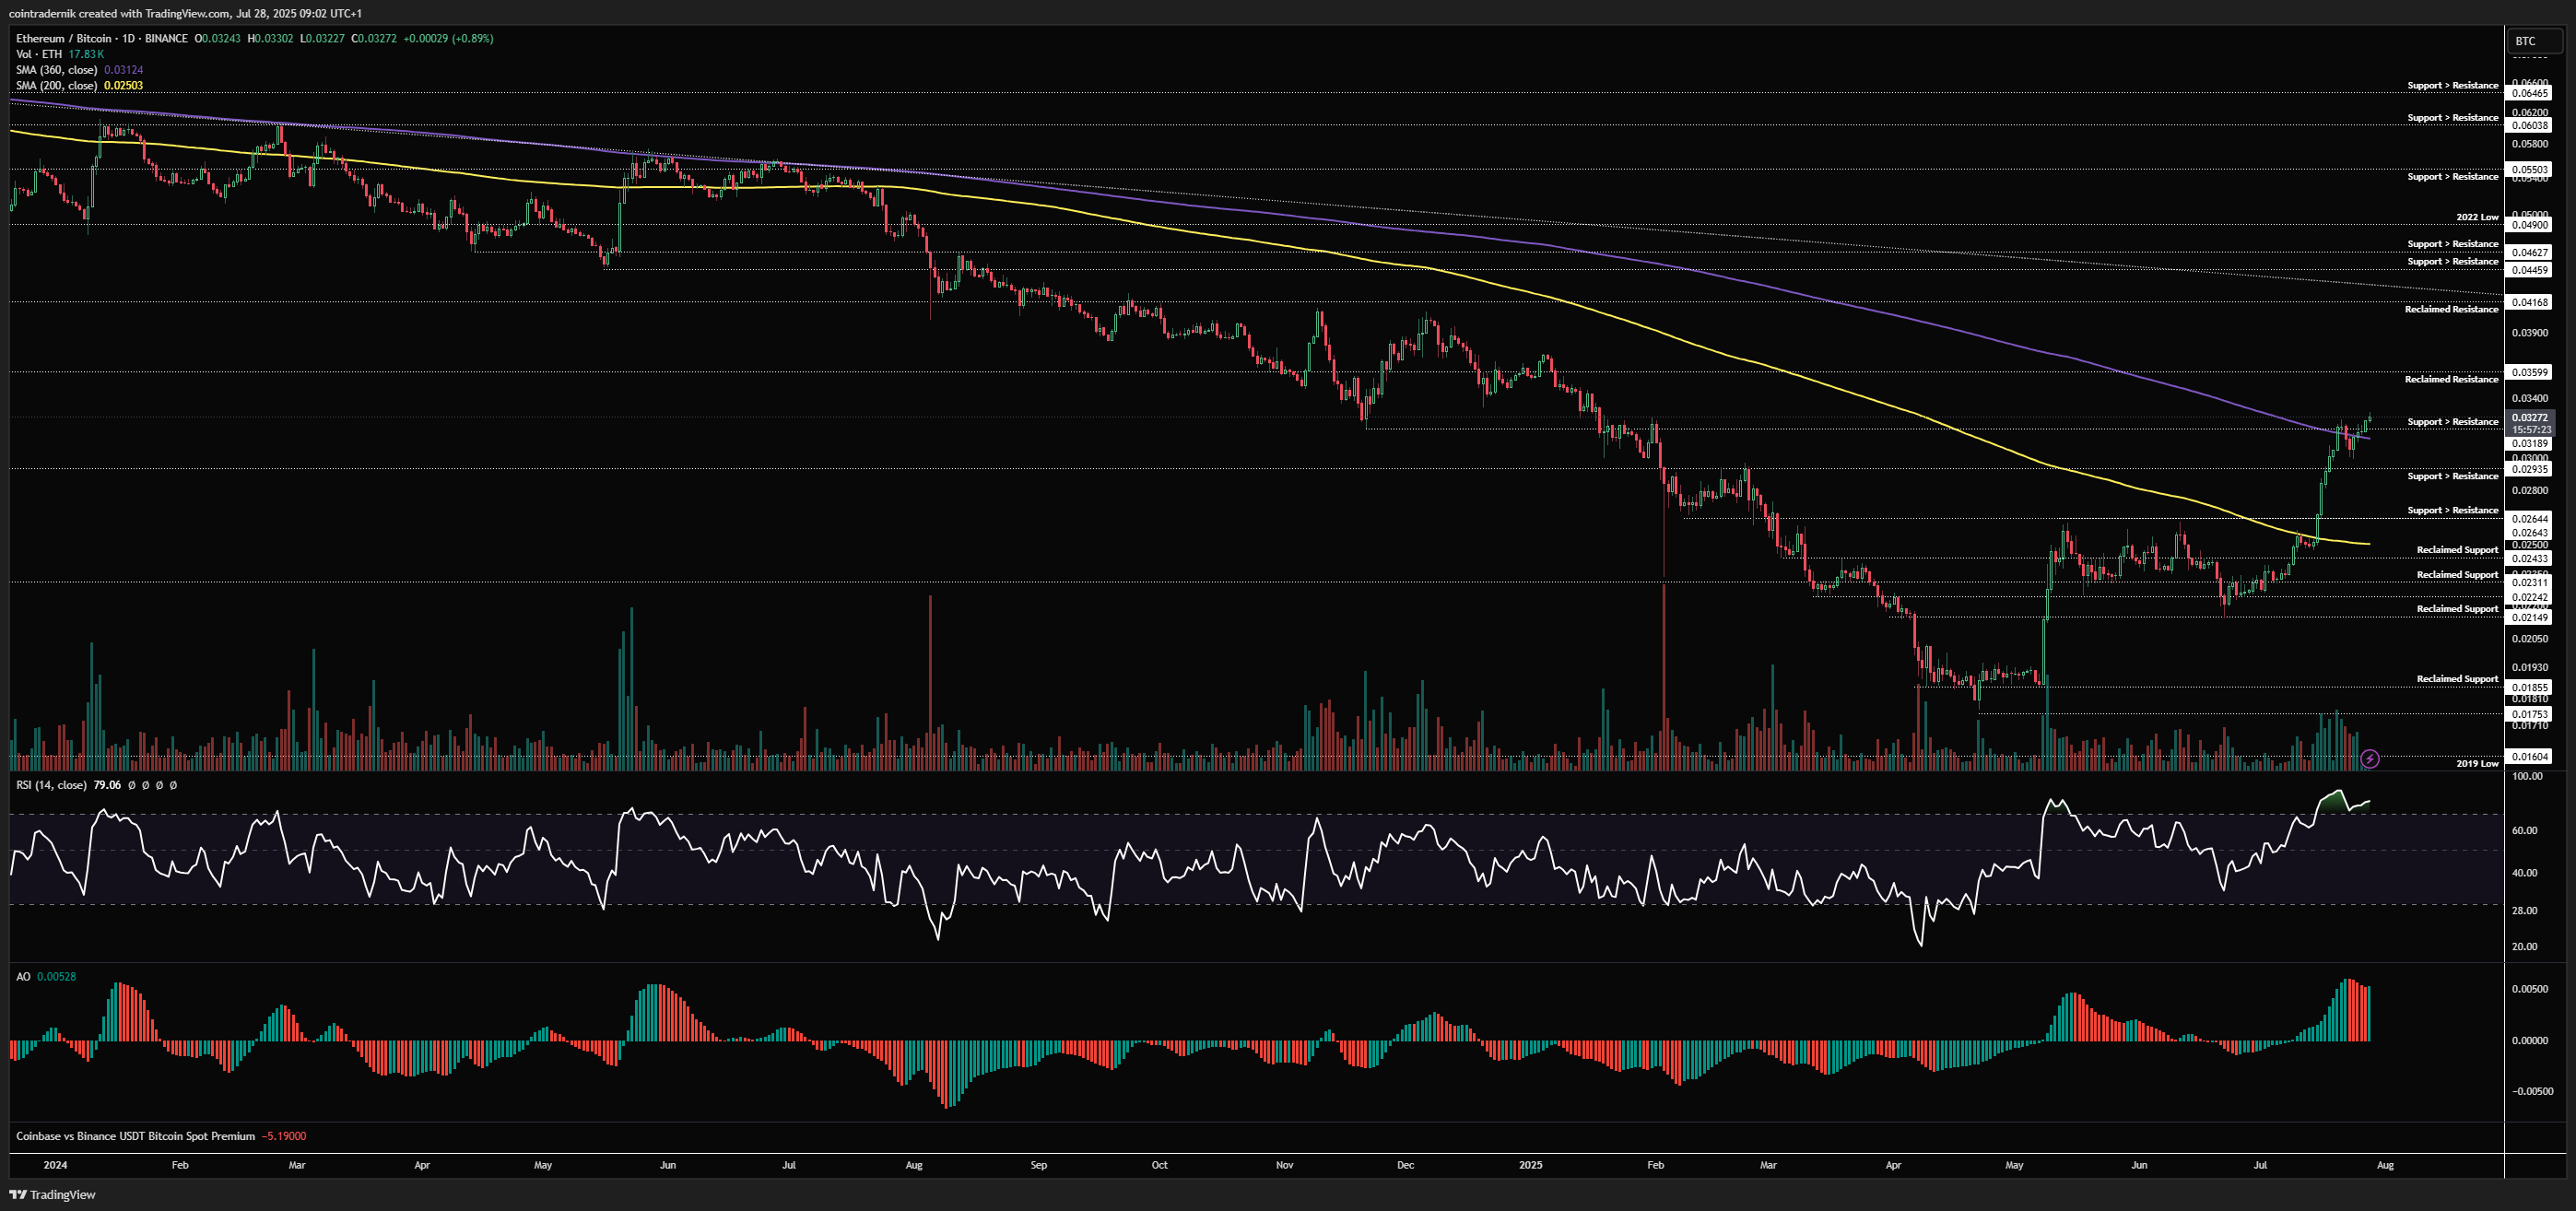
Looking at the daily, we can see that price rejected at the 360dMAand then found support, marking out a higher-low and then reclaiming 0.0319 as support, above which it is currently sat. There is the possibility (much like the Dollar pair) that we could form bearish divergence here this week, where a lower-high in momentum followed by price closing the week back below 0.0319 would look local toppy for the first couple of weeks of August. If price keeps grinding higher and drags momentum up with it, we could be at 0.036 by the end of this week to be honest. Ultimately, whether you get a pull-back this week or a pull-back into mid-August, buy the fucking dip because there is nothing here that looks like a major top on ETH yet and we likely have the most explosive leg of the move to come when the Dollar pair accepts above $4100.
Subscribe to Ostium Labs
Receive the latest updates directly to your inbox
Your subscription could not be saved. Please try again.
Your subscription has been successful.
Copper:
Price: $5.80
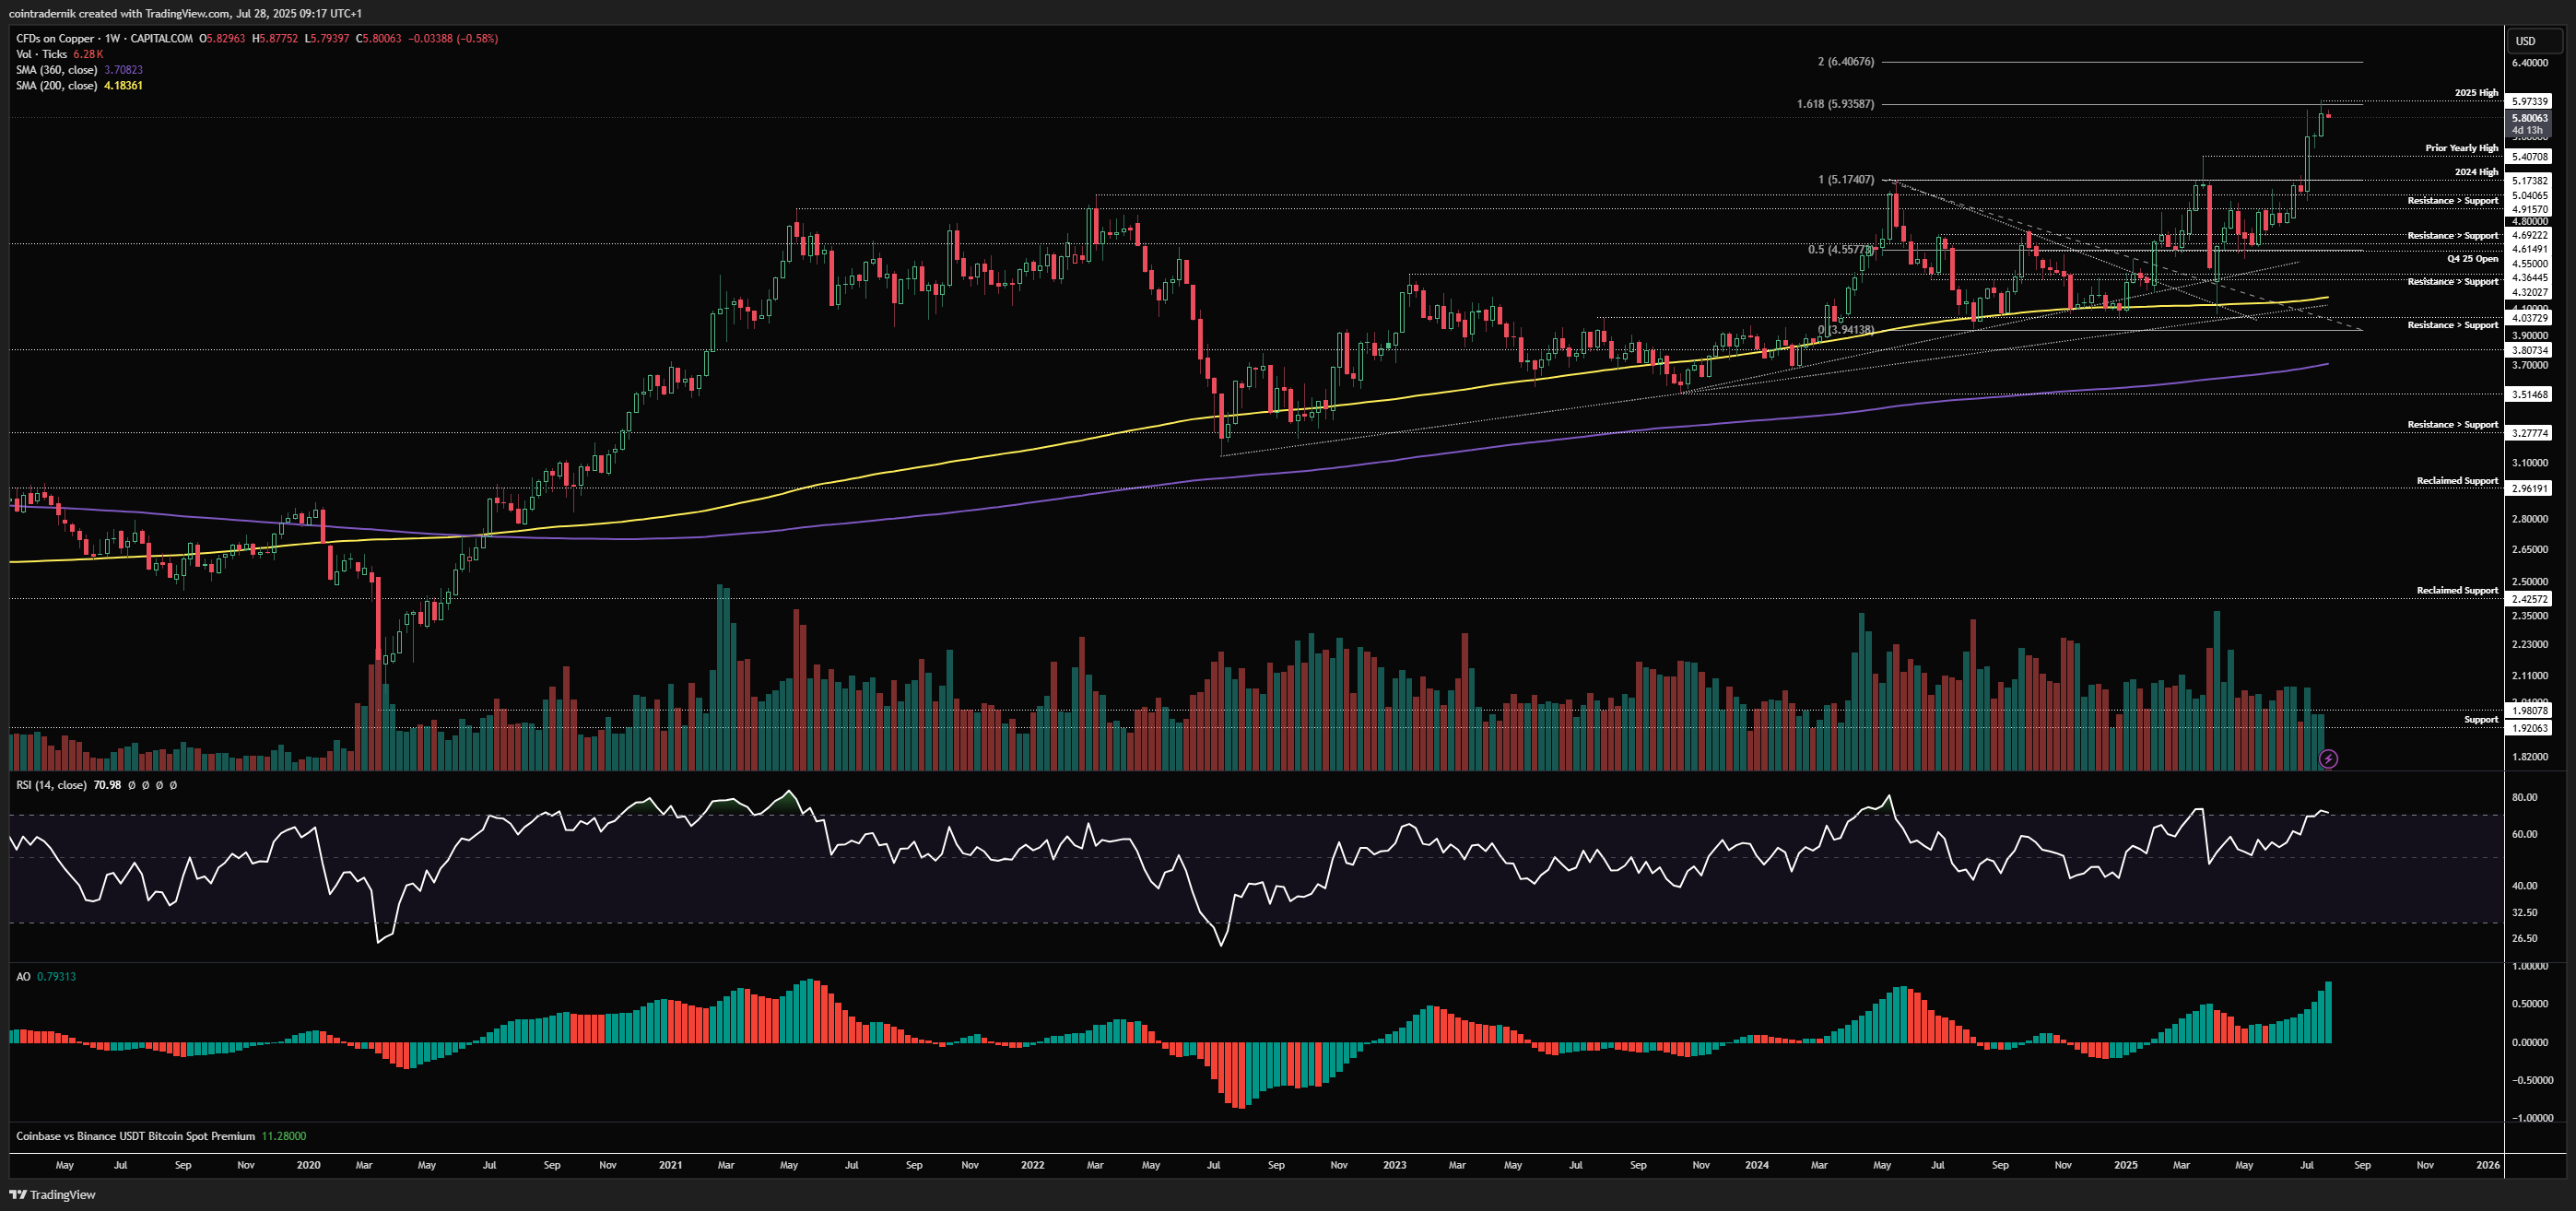
Weekly:
Beginning with the weekly for Copper, as outlined a few weeks ago, price ripped higher following consolidation and as of last week made a fresh 2025 high just shy of $6, right at 1.618 extension of the prior range. Acceptance above this level would lead to another leg higher into $6.40, where the 200% extension of the range sits. Copper is very much in a BTFD environment whilst it holds above the previous yearly high at $5.40. Close back below that and we should be more cautious but momentum and structure are firmly bullish here and supportive of continuation higher through Q3 into Q4.
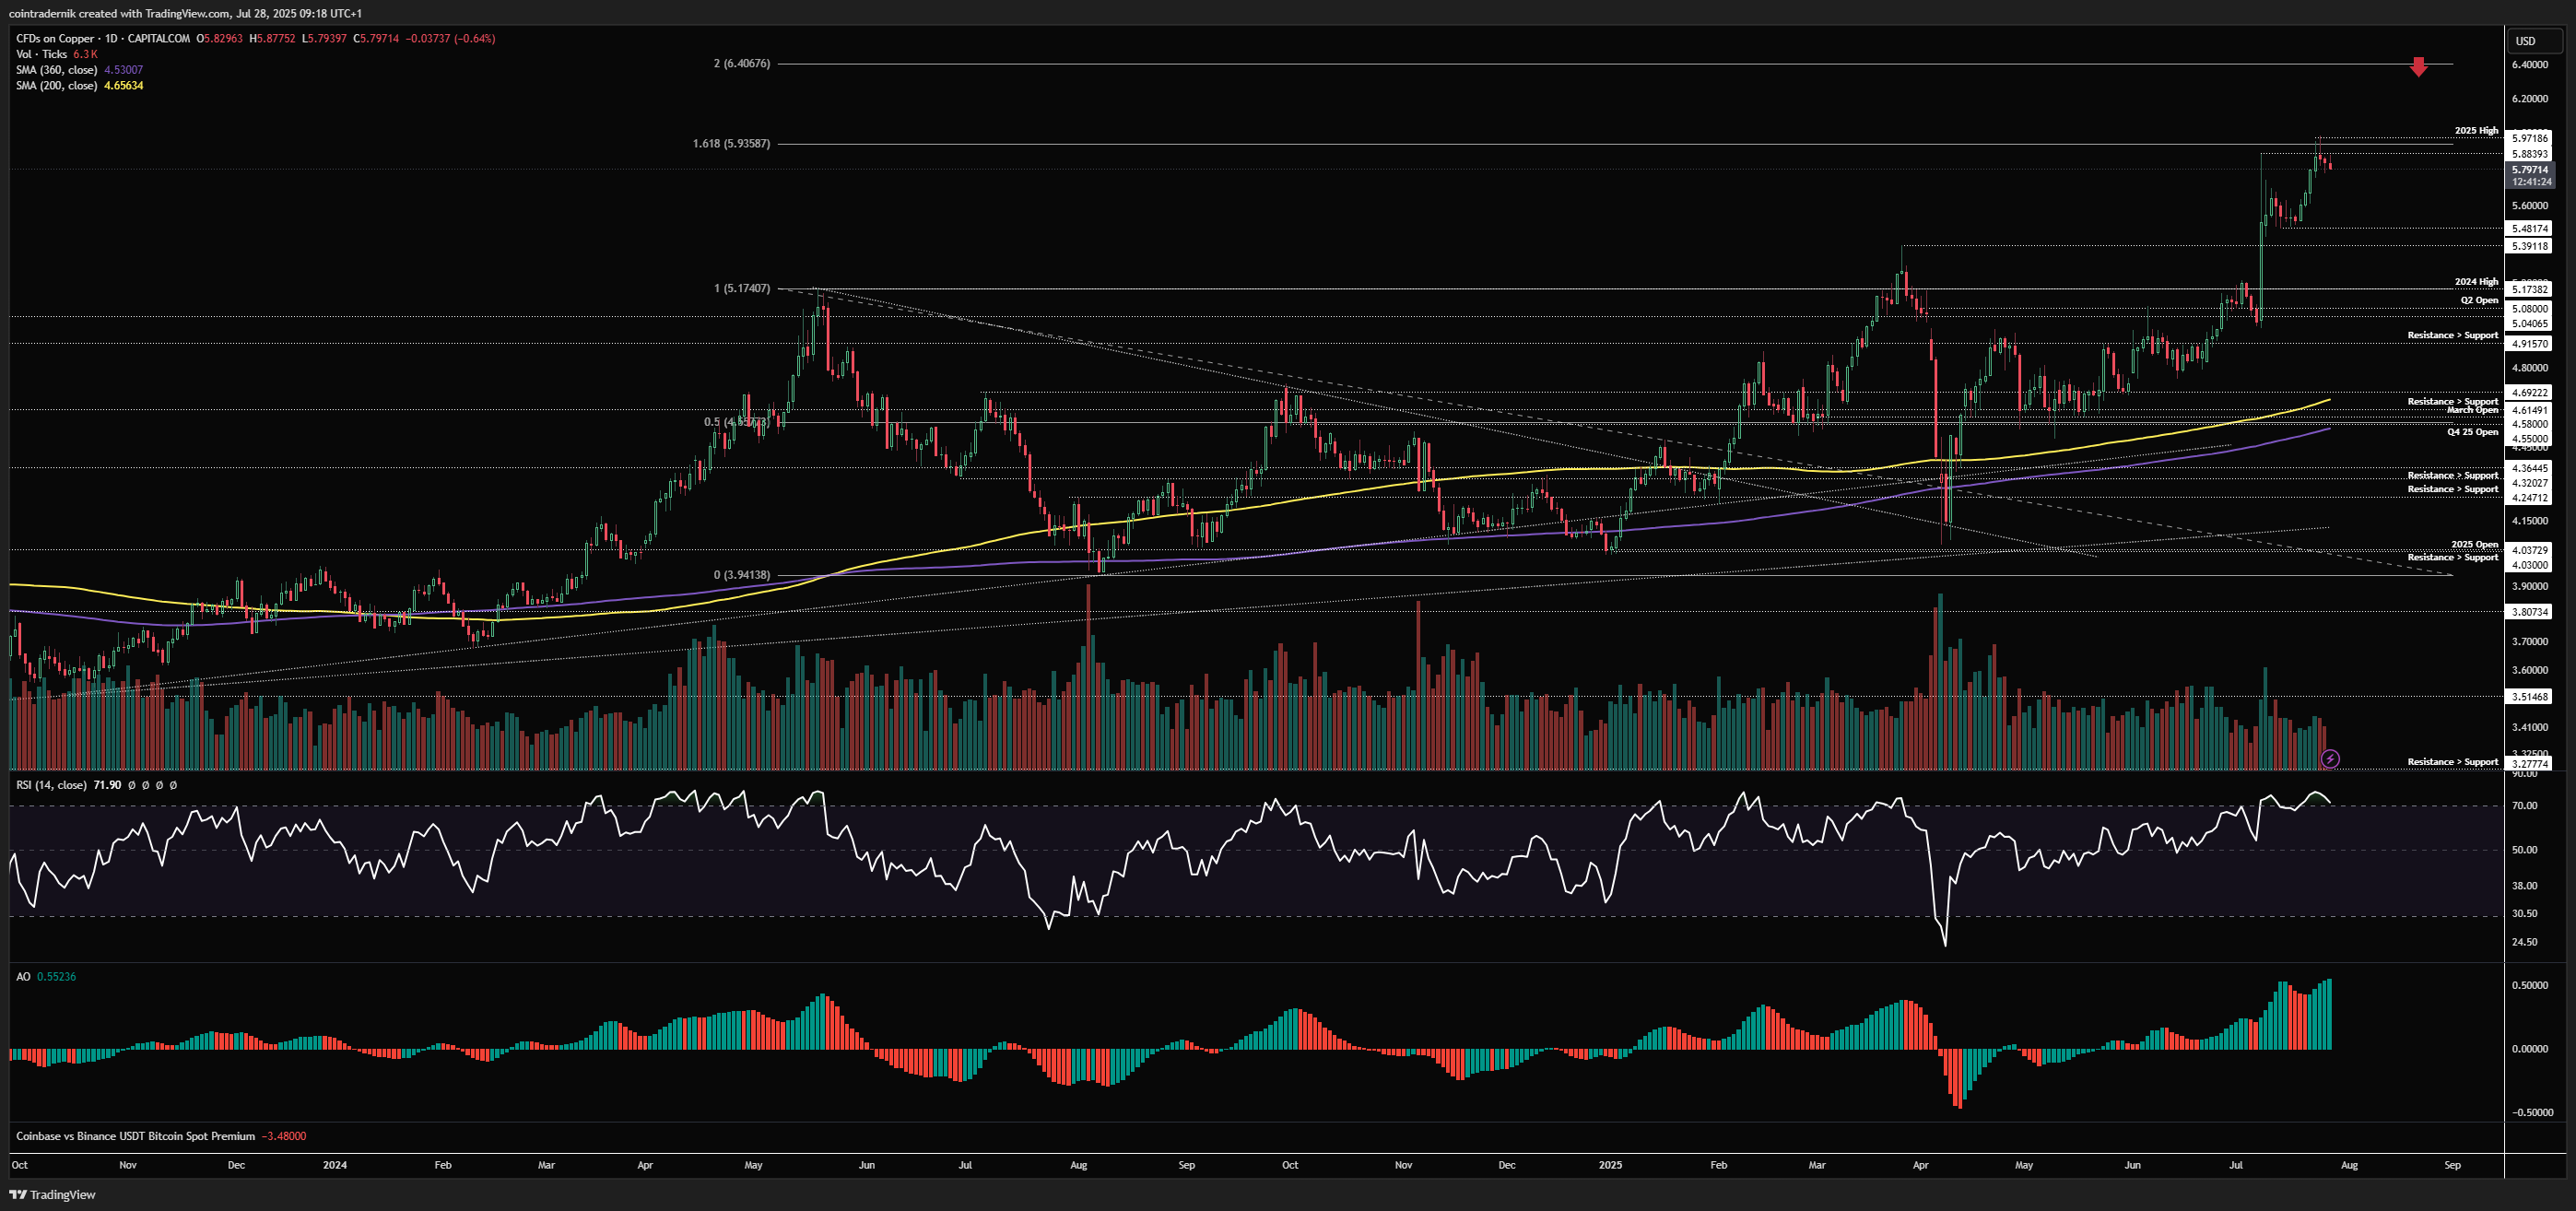
Daily:
Dropping into the daily, despite some signs of rejection here at the highs, we don't have confirmation of momentum exhaustion, so I would expect any pull-backs here to continue to be shallow and price to form a higher-low above $5.48, from which it extends through $6 into $6.40 in August. As mentioned above, the major signal for this not being the more probable path would be $5.40 turning resistance again, but for now it is support and momentum is pointing towards higher prices. Don't overcomplicate it.
DXY:
Price: 97.62
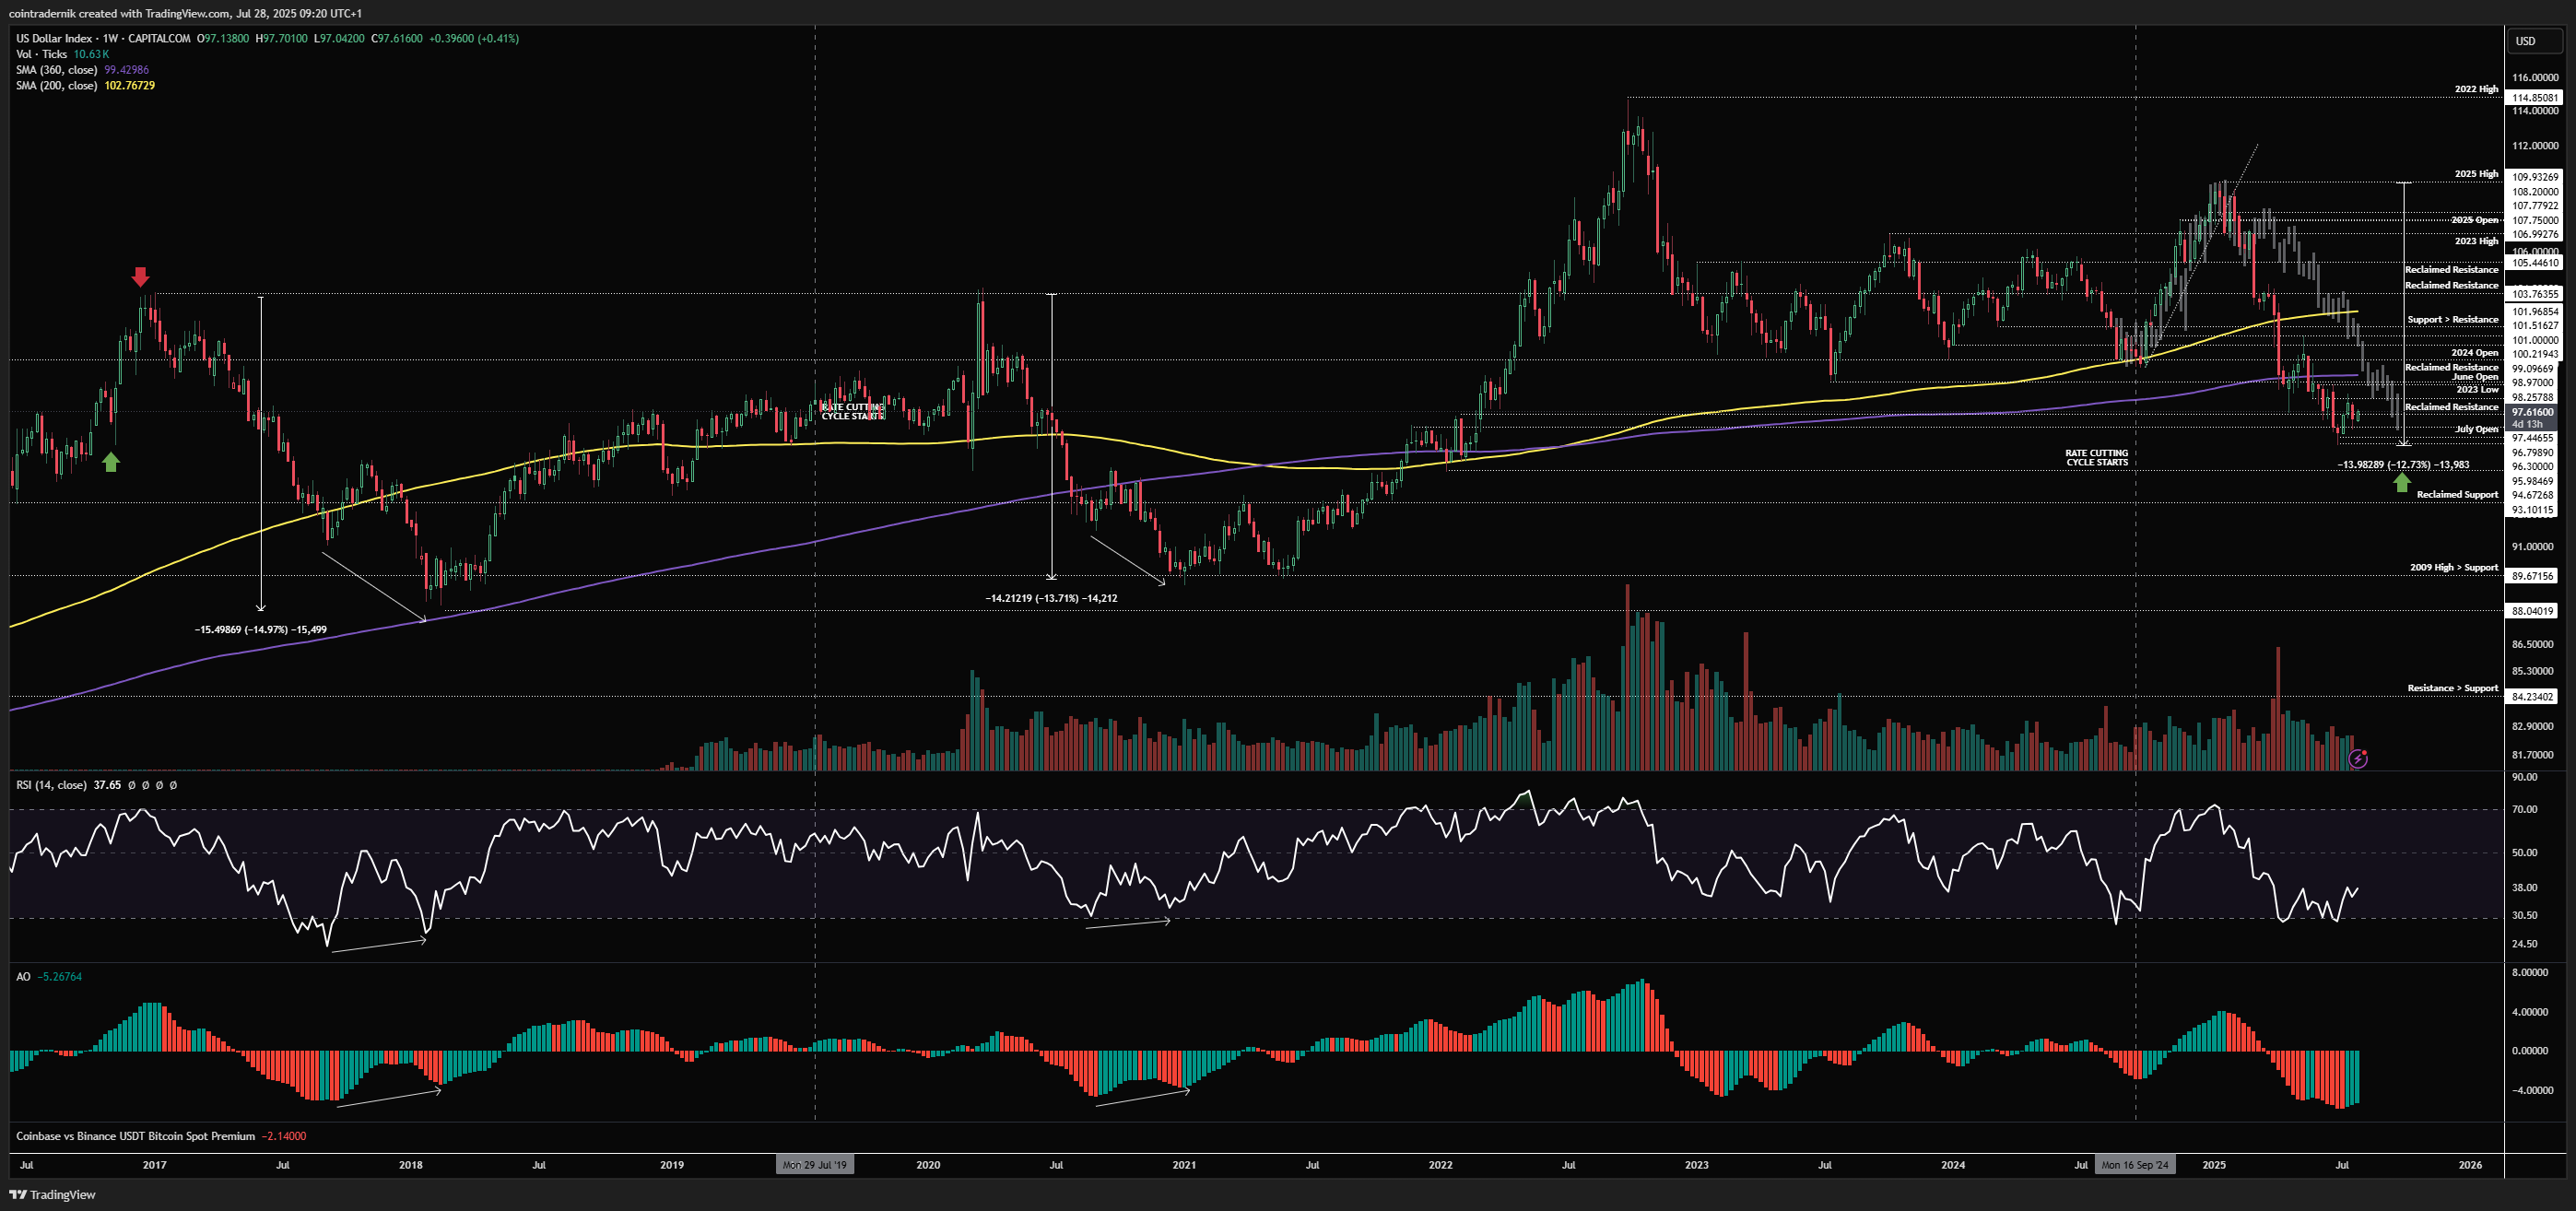
Weekly:
Looking at the weekly for the Dollar Index, we can see that price is finally marking out a bottom here, having formed a low at 96 before rejecting at resistance on the bounce but then finding support at a higher-low last week. We need to see DXY now close above 98.3 for confirmation of this shift, where we could then expect a decent short squeeze given all of the short positioning, likely into the 101 handle before marking out another local top. If 98.3 fails to give way here, this higher-low means very little and we would expect to see this bottoming structure invalidated. Going into Q4 I do still expect one leg lower on DXY towards that 93-94 range, where we may see bullish divergence begin to form for a longer-term reversal.
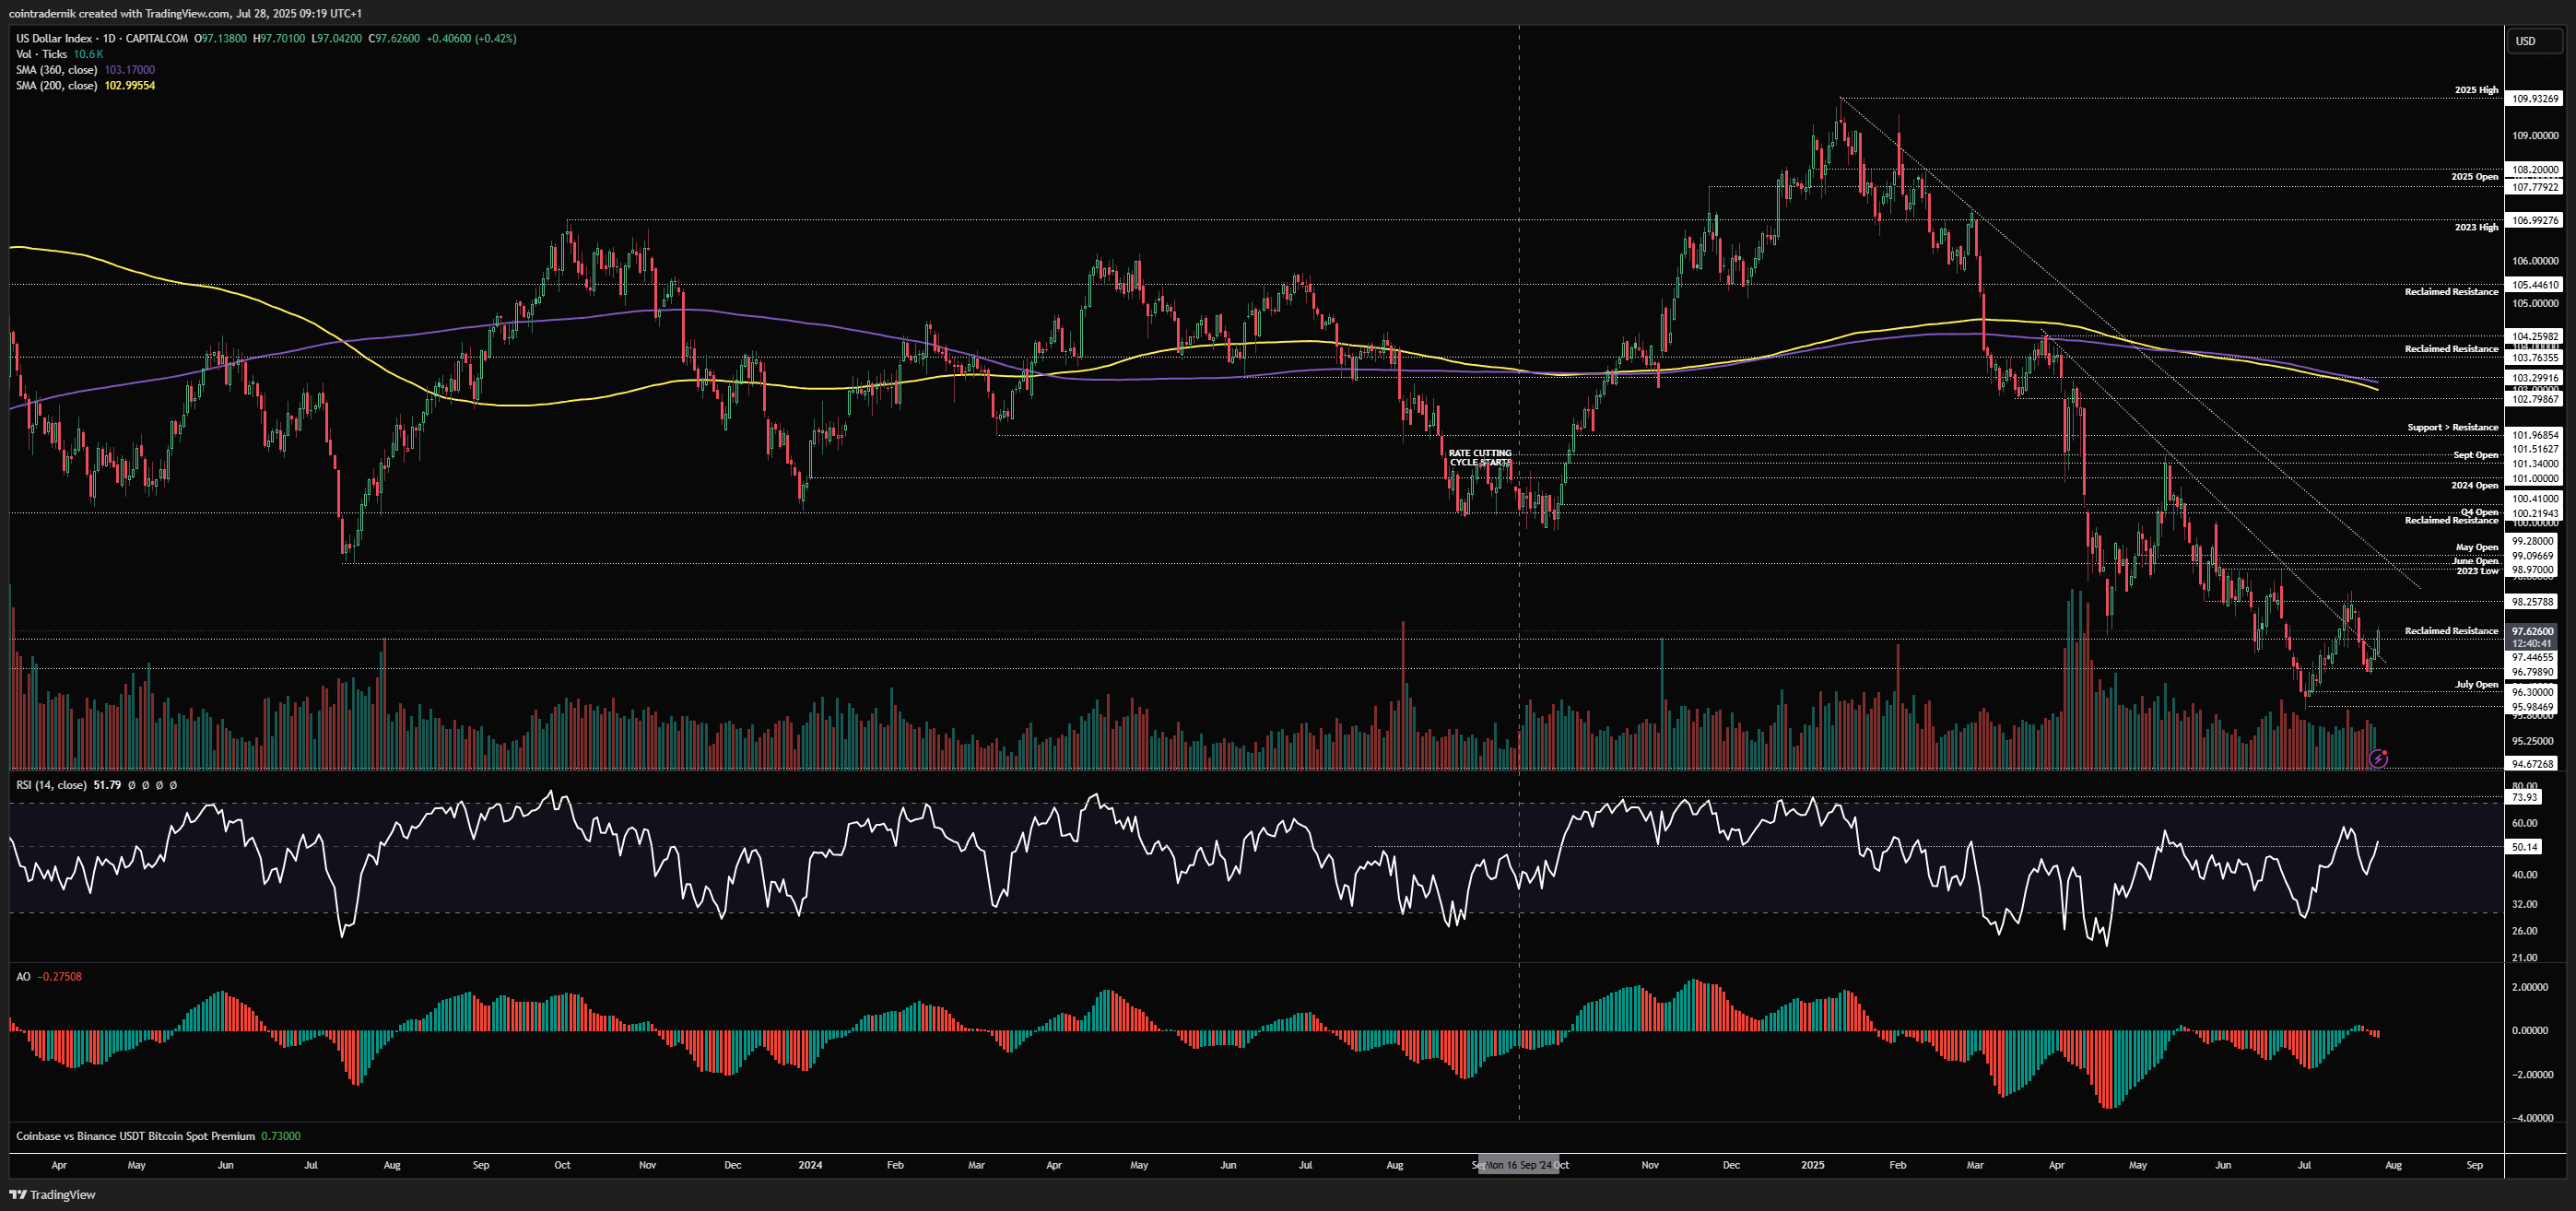
Daily:
Looking at the daily, we can see that price marked out that higher-low at 96.8 after momentum broke briefly back above 50 on daily RSI (where the last fake-out occurred). Local trendline resistance has also been broken, giving validity to this structural shift, and if we can break and close above 98.3 we have bullish structure on this timeframe and I would price to squeeze through that overhead resistance around 99 to bait longs and force shorts to close out before marking out a top into that 100-101 range and then reversing lower again once that historical positioning begins to puke. This is the most bullish the dollar has looked in quite some time, right as consensus went bearish into range lows...
Others:
Price: $308bn
OTHERS/USD
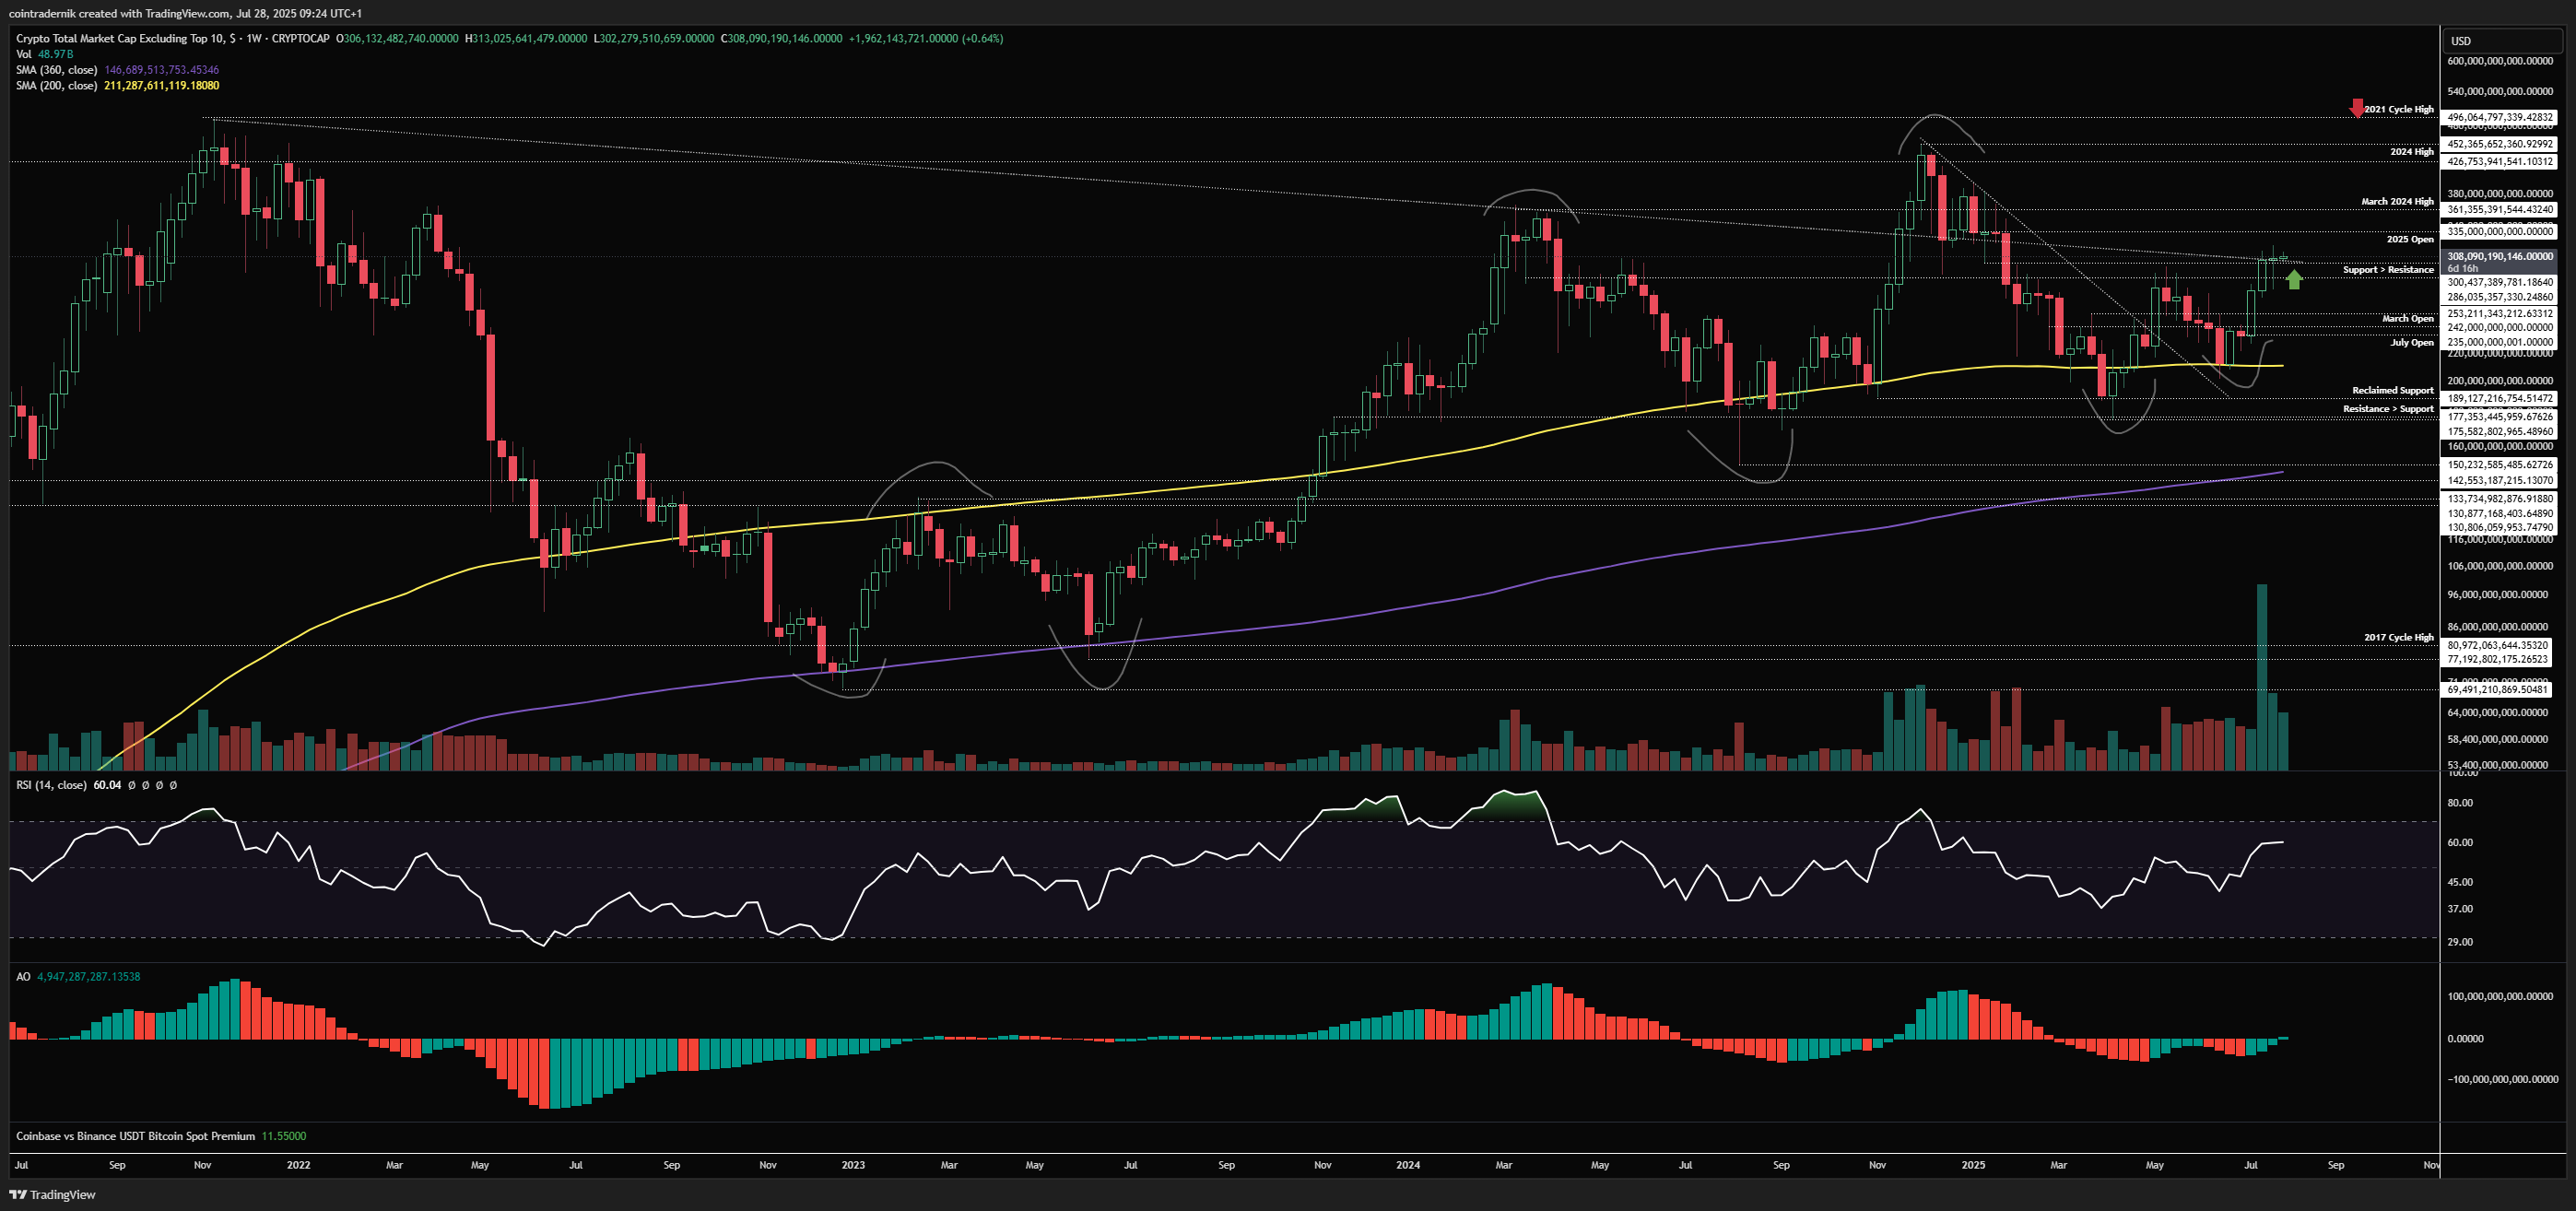
Weekly:
Beginning with the weekly for OTHERS/USD, we have a higher-high and higher-low formation following the weekly close through $300bn within the multi-year uptrend that began in late 2022. Momentum is bullish and the volume on the breakout candle was massive, validating this move, particularly as we have also retested the level as support and bounced off it last week to close marginally through that trendline. I would expect alts to continue higher here into the 2025 open at $335bn, where we may find some resistance (though if we are just following ETH's lead with a lag then this area will be sliced through like butter). As long as OTHERS does not now flip the $286bn-$300bn range back into resistance, this is looking great for another leg higher towards the March 2024 high at $361bn and then continuation into the all-time highs going into Q4. Close back below $286bn on the weekly and I think alts head towards the $250bn area to mark out another higher-low during August and early September.
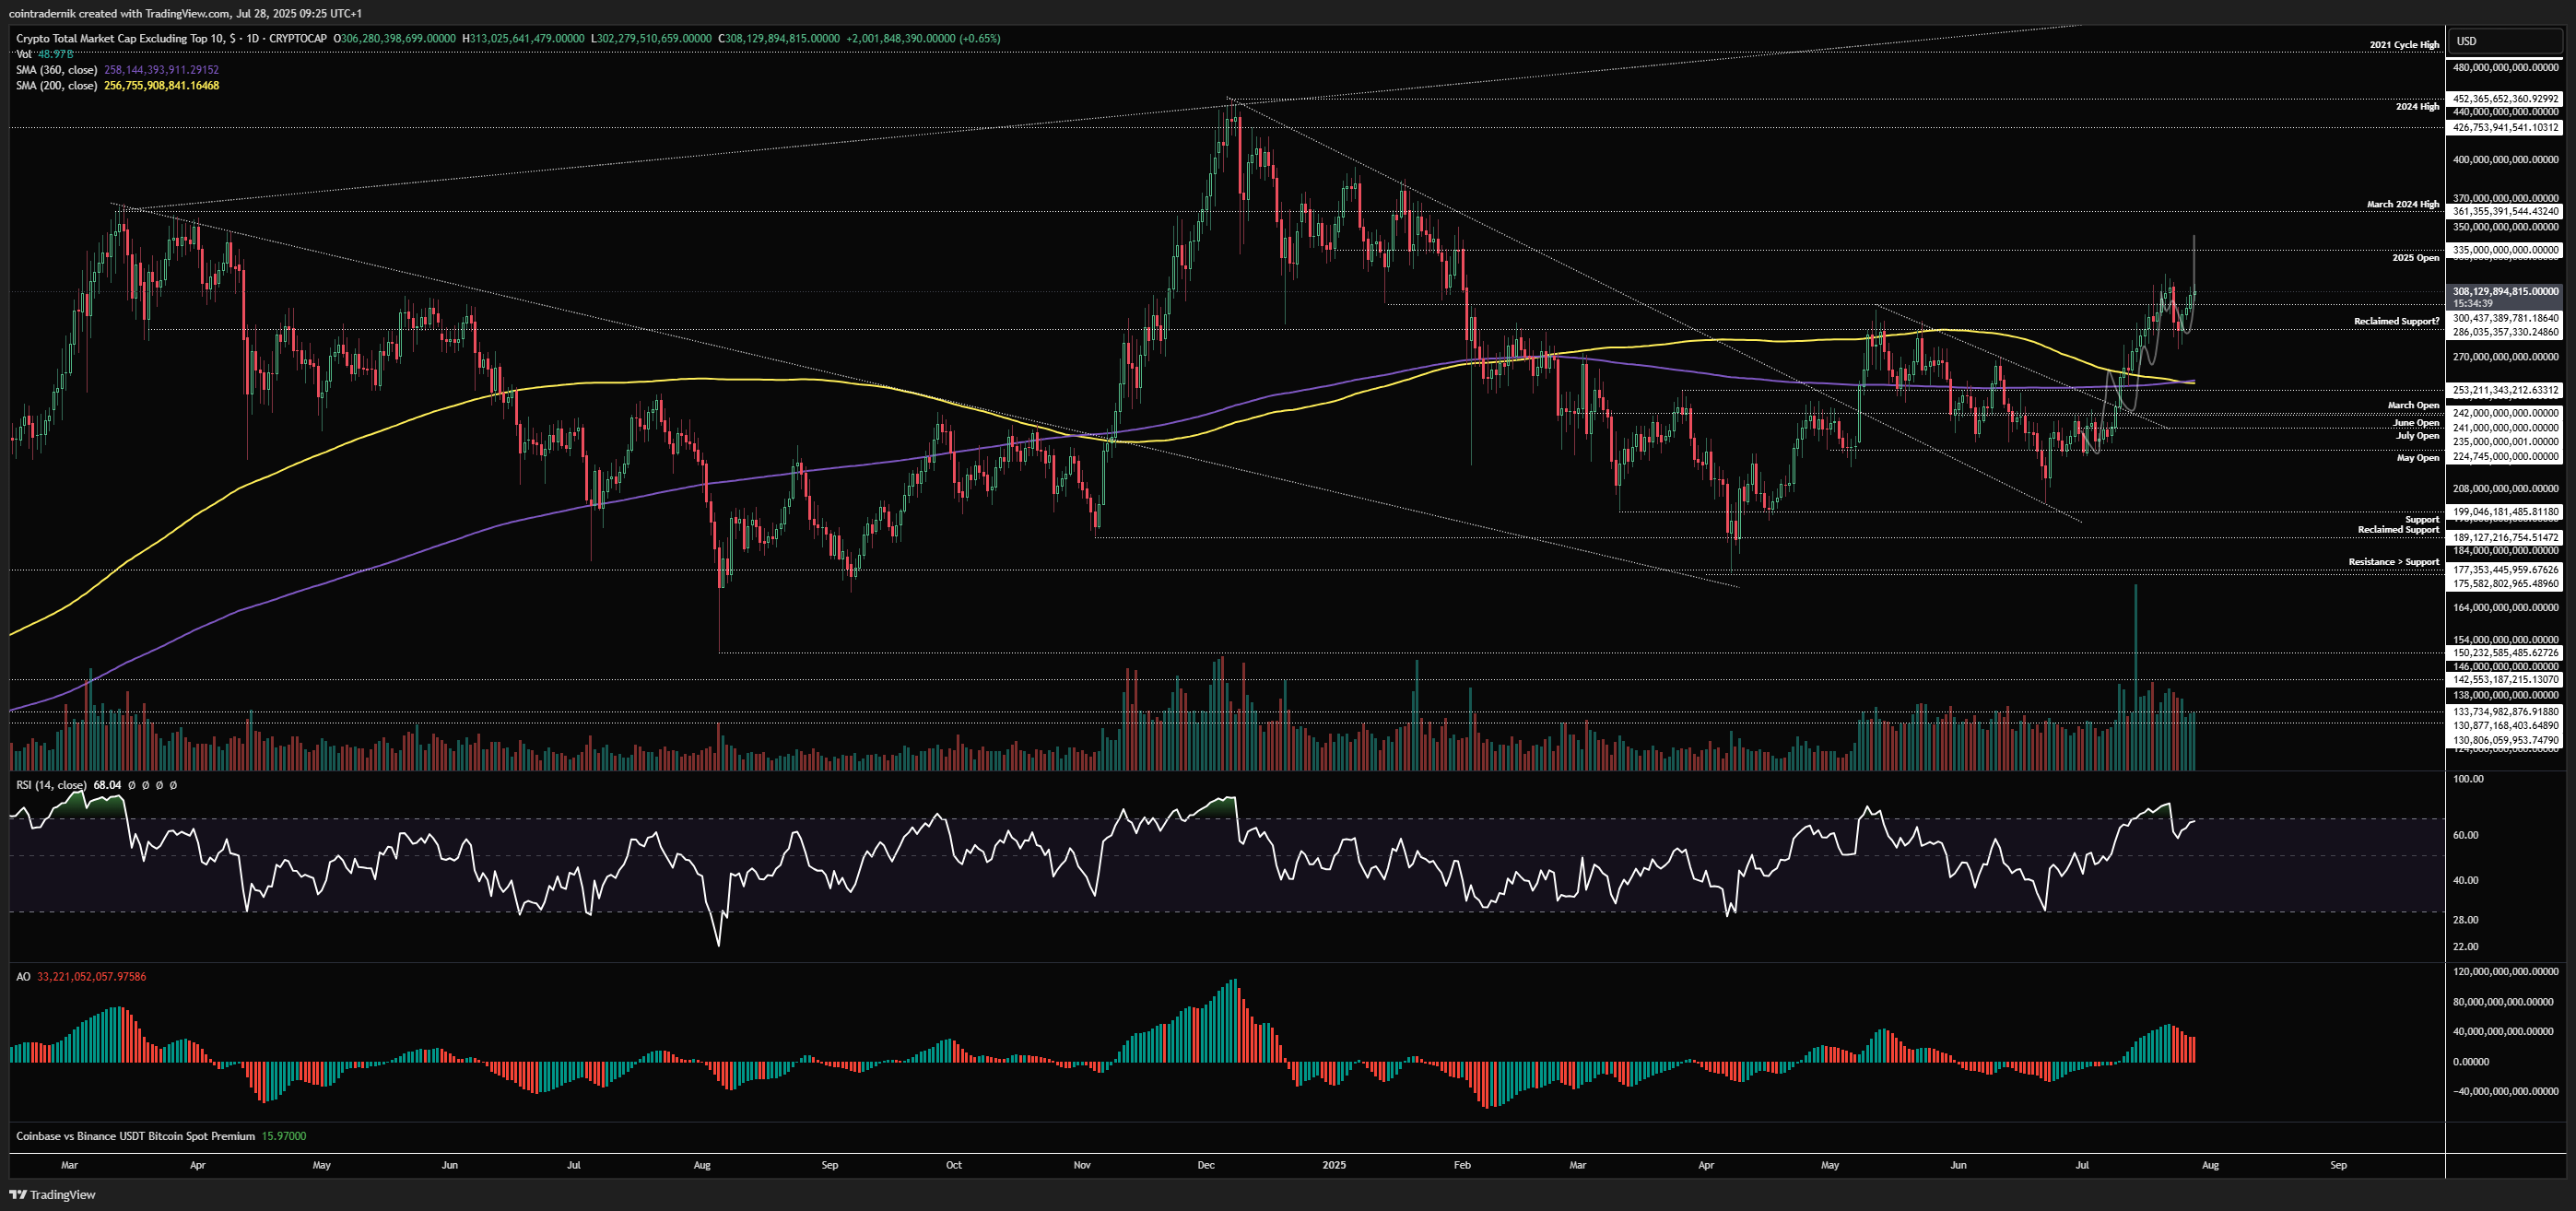
Daily:
As we can see on the daily, the squiggly played out perfectly from early July and we even got that pull-back into reclaimed support last week, which held firm. I've mentioned innumerable times how much headline risk there is this week, so assuming we get through that unscathed into early August we should see OTHERS continue to rip higher from here, where acceptance above the yearly open leads to that next leg higher, likely into $420bn. I don't think we see a breakout through all-time highs until Q4, but let's see how things look as we head into August. Any dip into the 360dMA and 200dMA confluence around $250bn would be an opportunity to add alt exposure, in my view.
OTHERS/BTCUSD
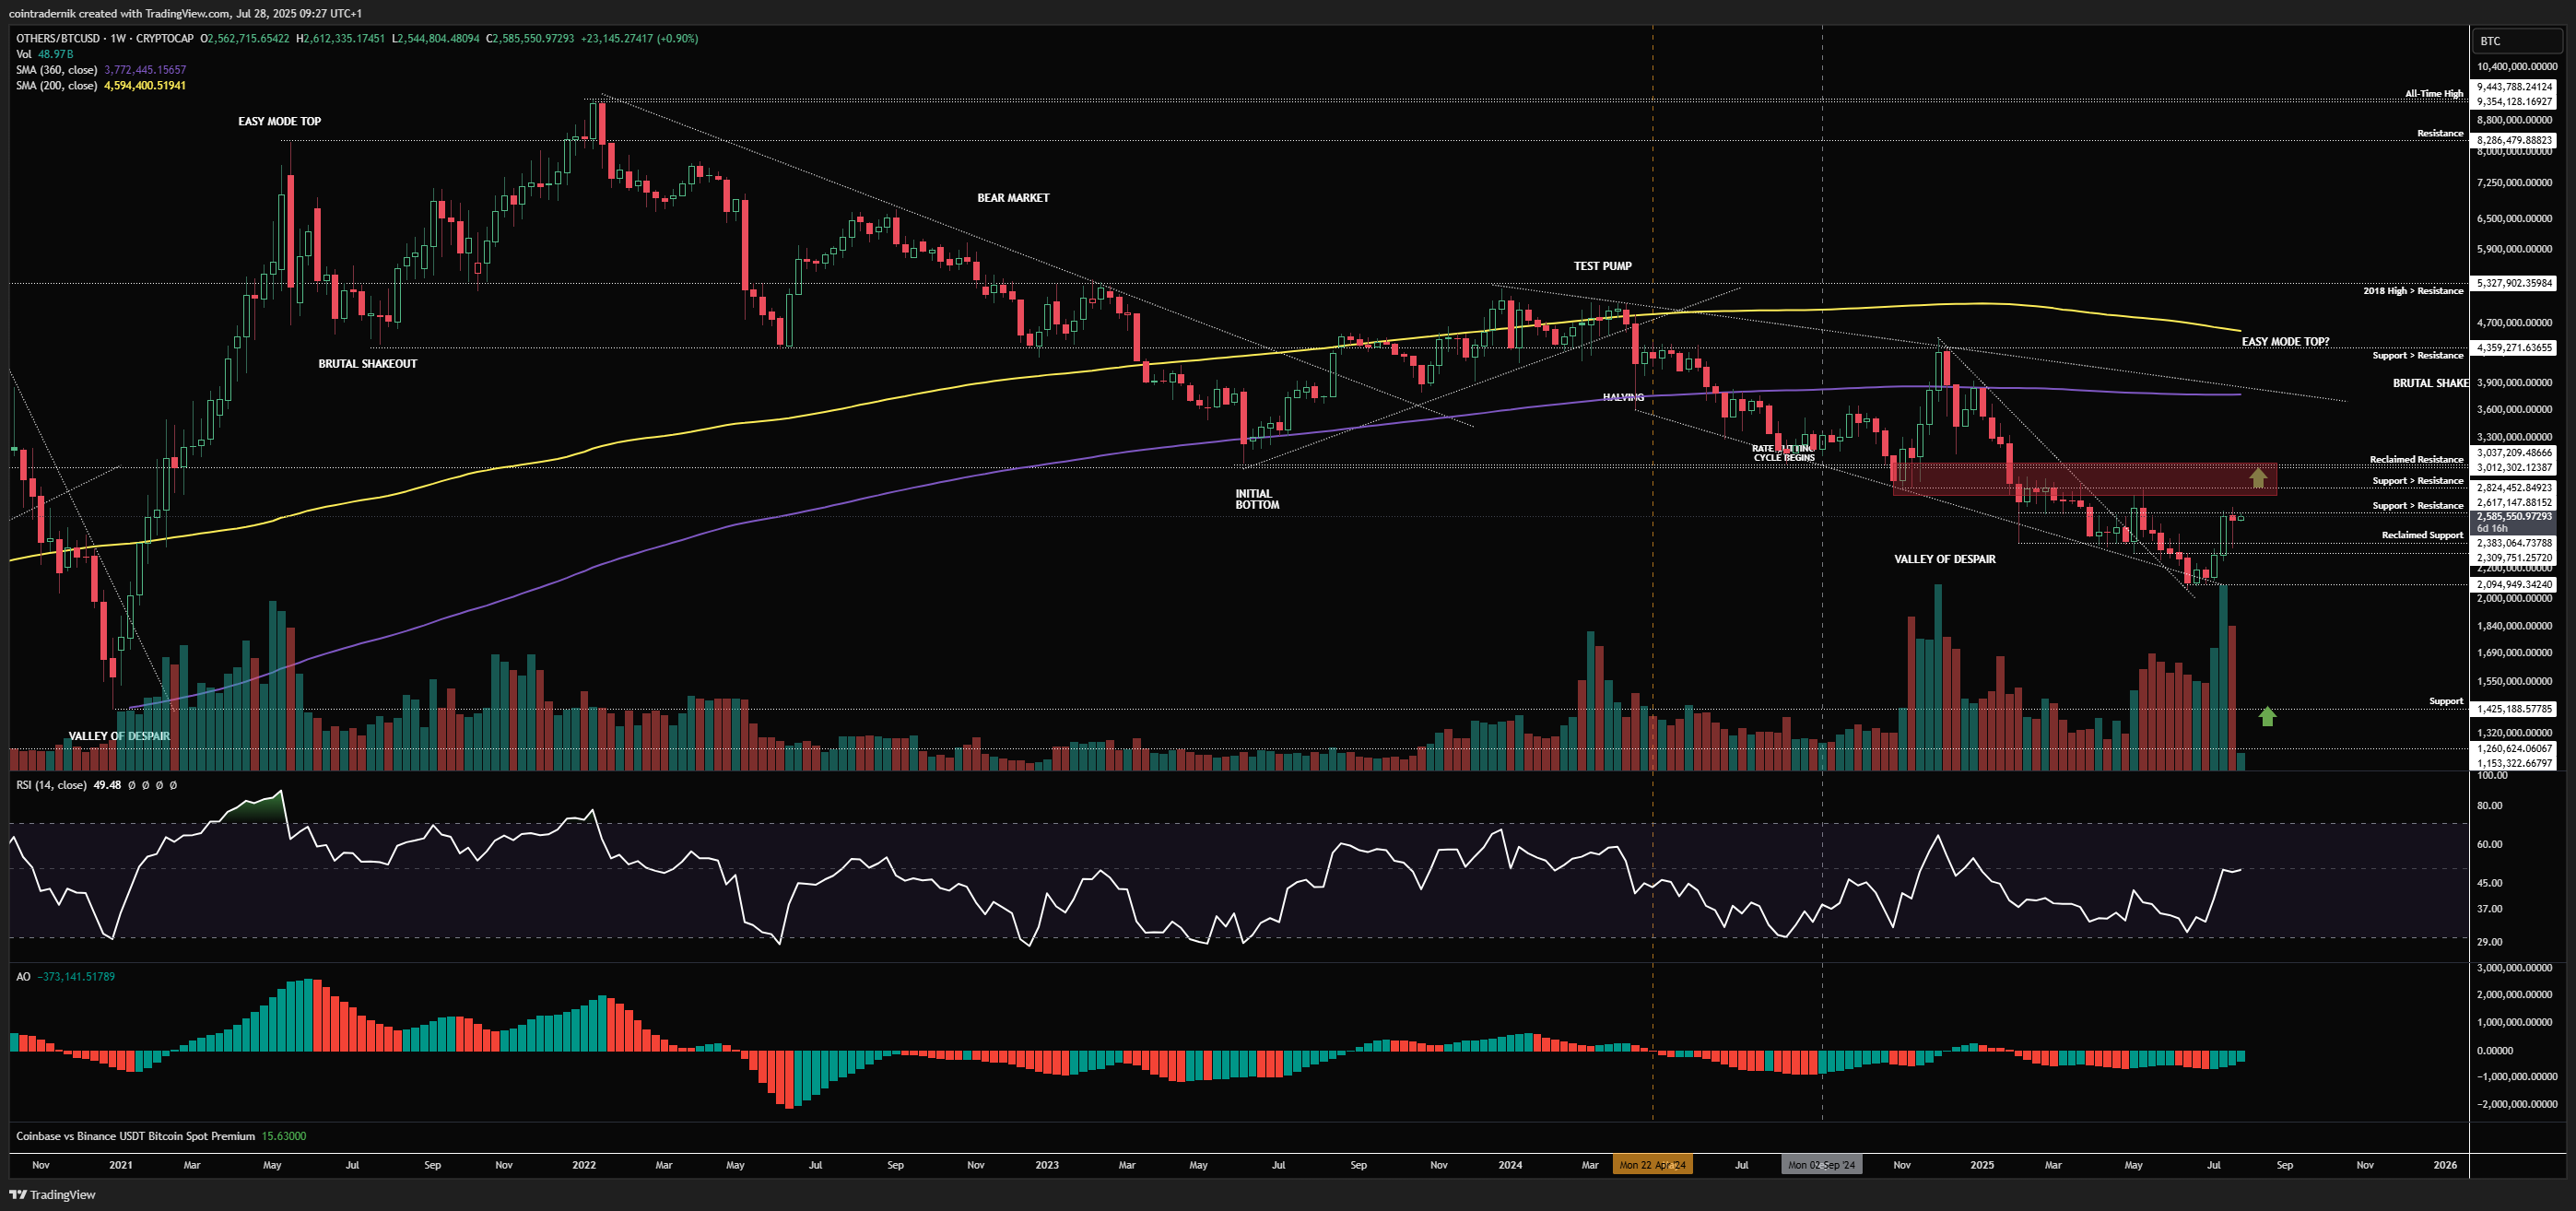
Weekly:
Looking at the weekly for OTHERS/BTC, we have finally put in some decent outperformance off the lows for alts vs BTC and momentum has put in a higher-high like in summer 2023 and Nov 2024. We have reclaimed one level of support at 2.3mn BTC, which held firm last week, with alts now sat right below that major support turned resistance at 2.6mn BTC. This is the last level before we approach the major resistance cluster that has been pivotal all cycle around 3mn BTC, above which I think we see the classical wide-breadth altcoin outperformance that has been lacking this whole cycle. If we reject here, we likely just continue to chop in this tight range, where only a break back below 2.3mn BTC makes it probable that alts haven't actually put in a longer-term bottom vs BTC and instead make fresh lows through 2.1mn. Again, I don't think we see that acceptance above 3mn BTC until we head into Q4, but a weekly close above 2.82mn BTC would turn weekly structure bullish for altcoin dominance vs BTC.
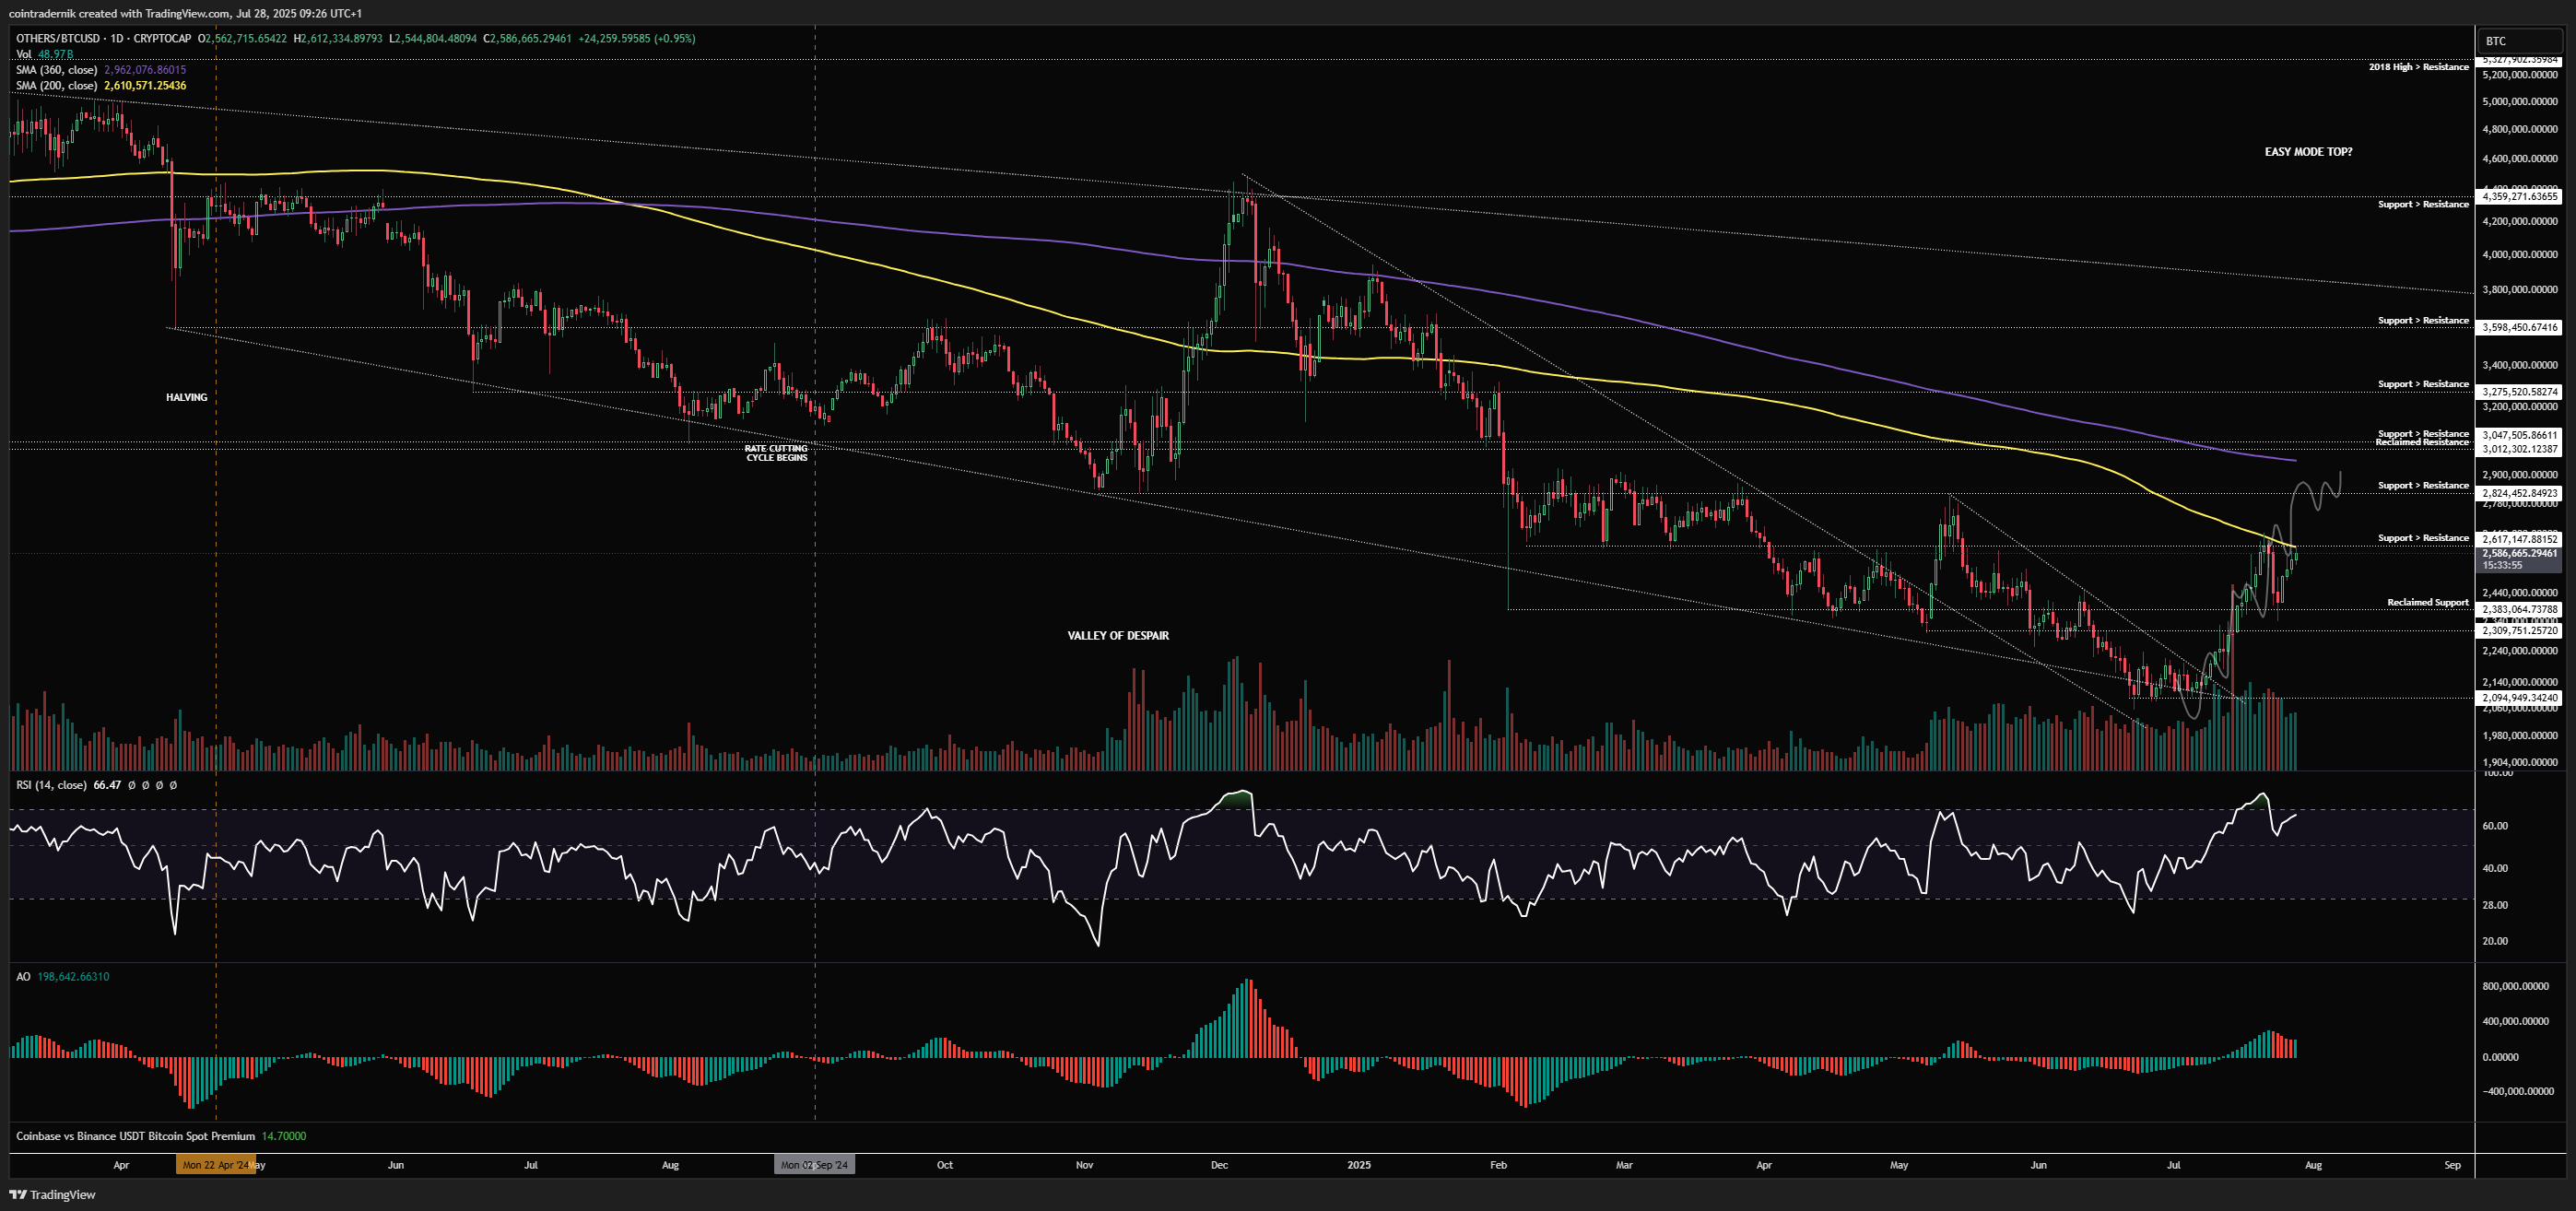
Daily:
Finally, looking at the daily, we can see that alts are pressing up against resistance from the 200dMA here vs BTC, aligned with that 2.6mn BTC level that was prior support. Flip this level back into support and I do think we get 15% of further upside into the 360dMA and 3mn BTC level, where I don't think we break through on the first attempt but rather pull back and shakeout what will likely be some derivatives froth following that leg higher. Daily structure is very much bullish here as long as 2.3mn BTC holds.
I hope you've found some value in the read this week!
And if you've not already signed up for Ostium, please do so and test out some of the recent updates, including:
On-chain leverage for indices including NDX, SPX, FTSE & more...
Unified accounts and gas-free trading
Single-stock perpetuals, including TSLA, NVDA and META


-2025-07-28_08_43_11.png)
-2025-07-28_08_50_38.png)