This blog references an opinion and is for entertainment and informational purposes only. It is not intended to be investment advice. Seek a duly licensed professional for investment advice.
In this 40th Market Outlook here at Ostium Research, we'll be taking a look at the week ahead in markets, focusing specifically on price-action, positioning and event risk for Bitcoin, Ethereum, DXY, SPX and altcoins, via OTHERS.
Firstly, let's take a look at the stacked calendar ahead:
MONDAY: CHICAGO PMI (JUNE): (CONSENSUS 43 VS PREVIOUS 40.5)
MONDAY: VARIOUS FED SPEECHES
MONDAY: ECB PRESIDENT LAGARDE SPEECH
TUESDAY: FED CHAIR POWELL FED SPEECH
TUESDAY: BOJ GOVERNOR UEDA SPEECH
TUESDAY: ECB PRESIDENT LAGARDE SPEECH
TUESDAY: US ISM MANUFACTURING PMI (JUNE): (CONSENSUS 48.8 VS PREVIOUS 48.5)
TUESDAY: US JOLTS JOB OPENINGS (MAY): (CONSENSUS 7.3M VS PREVIOUS 7.391M)
WEDNESDAY: ADP EMPLOYMENT CHANGE (JUNE): (CONSENSUS 85K VS PREVIOUS 37K)
THURSDAY: US NON-FARM PAYROLLS (JUNE): (CONSENSUS 110K VS PREVIOUS 139K)
THURSDAY: US INITIAL JOBLESS CLAIMS: (CONSENSUS 240K VS PREVIOUS 236K)
THURSDAY: US ISM SERVICES PMI (JUNE): (CONSENSUS 50.5 VS PREVIOUS 49.9)
Now, let's dig into asset-specific price-action for the week ahead, looking firstly at Bitcoin:
Bitcoin:
Price: $107,658
Weekly:
If we begin by looking at the weekly for BTC, we can see that last week found support at prior resistance, holding that key $99k pivot and bouncing hard to engulf the prior weekly retracement and close at $108.4k. We are now sat right at the final resistance before price discovery, where any weekly close through $109.4k would confirm that the next leg higher is the likely path into July, so that's what I am watching for this week, ideally on growing volume. If, instead, we wick into this resistance area and reject this week, pushing lower again, then we would need to look to next week for either a break and close below $99k to confirm a mid-term top, likely taking us back into $89k where we would consolidate and re-accumulate before another attempt at a breakout later in Q3, or for a higher-low formation intraweek above that $99k level that then leads to the breakout next week. Seasonality is extremely strong for equities in July, particularly in post-election years, so with SPX at all-time highs and favourable flows ahead, I think acceptance above $112k over the next week or so for BTC would bring with it a multi-week rally towards $133k into August, where the next local top becomes more probable.
Daily:
Looking now at the daily, despite the rally price is still capped at the local trendline from all-time highs and is consolidating right around key resistance, with momentum still trending lower. Holding above that June open at $104.5k this week will likely be a clear sign for continuation higher, where any acceptance above $109.4k will lead to fresh all-time highs through $112k, with $124k as the next major resistance beyond that. Closing the daily below $106.8k here opens up that June open retest, where I do expect a higher-low to form; only if we accept back below that level does the more bearish trajectory towards $89k begin to look more probable, with it becoming extremely likely if we lose $99k, in my view. Not much else to add here for now...
Now, looking at the setups for the week, I particularly love taking longs when you have heavy weeks on the data front into quarterly or monthly closes and opens, which is where we are today. What we want to see to make this high probability is weakness early in the week (window-dressing + positioning ahead of key data), buying that weakness and then riding it into a stronger weekly close, as long as that overnight high at $109k remains unswept:
As mentioned above, I don't like shorts whilst we're holding above that June open, but if we squeeze higher early this week into tomorrow and put in some bearish divergence above $109.4k, I think you can fade that into Thursday to take out the weekend lows at least, then potentially looking to play it higher again from there if we form some bullish divergence into NFPs above the June open. This would be the classic 'fuck everyone up' move before price discovery:
And here's a snapshot of positioning across Velo and CoinGlass:
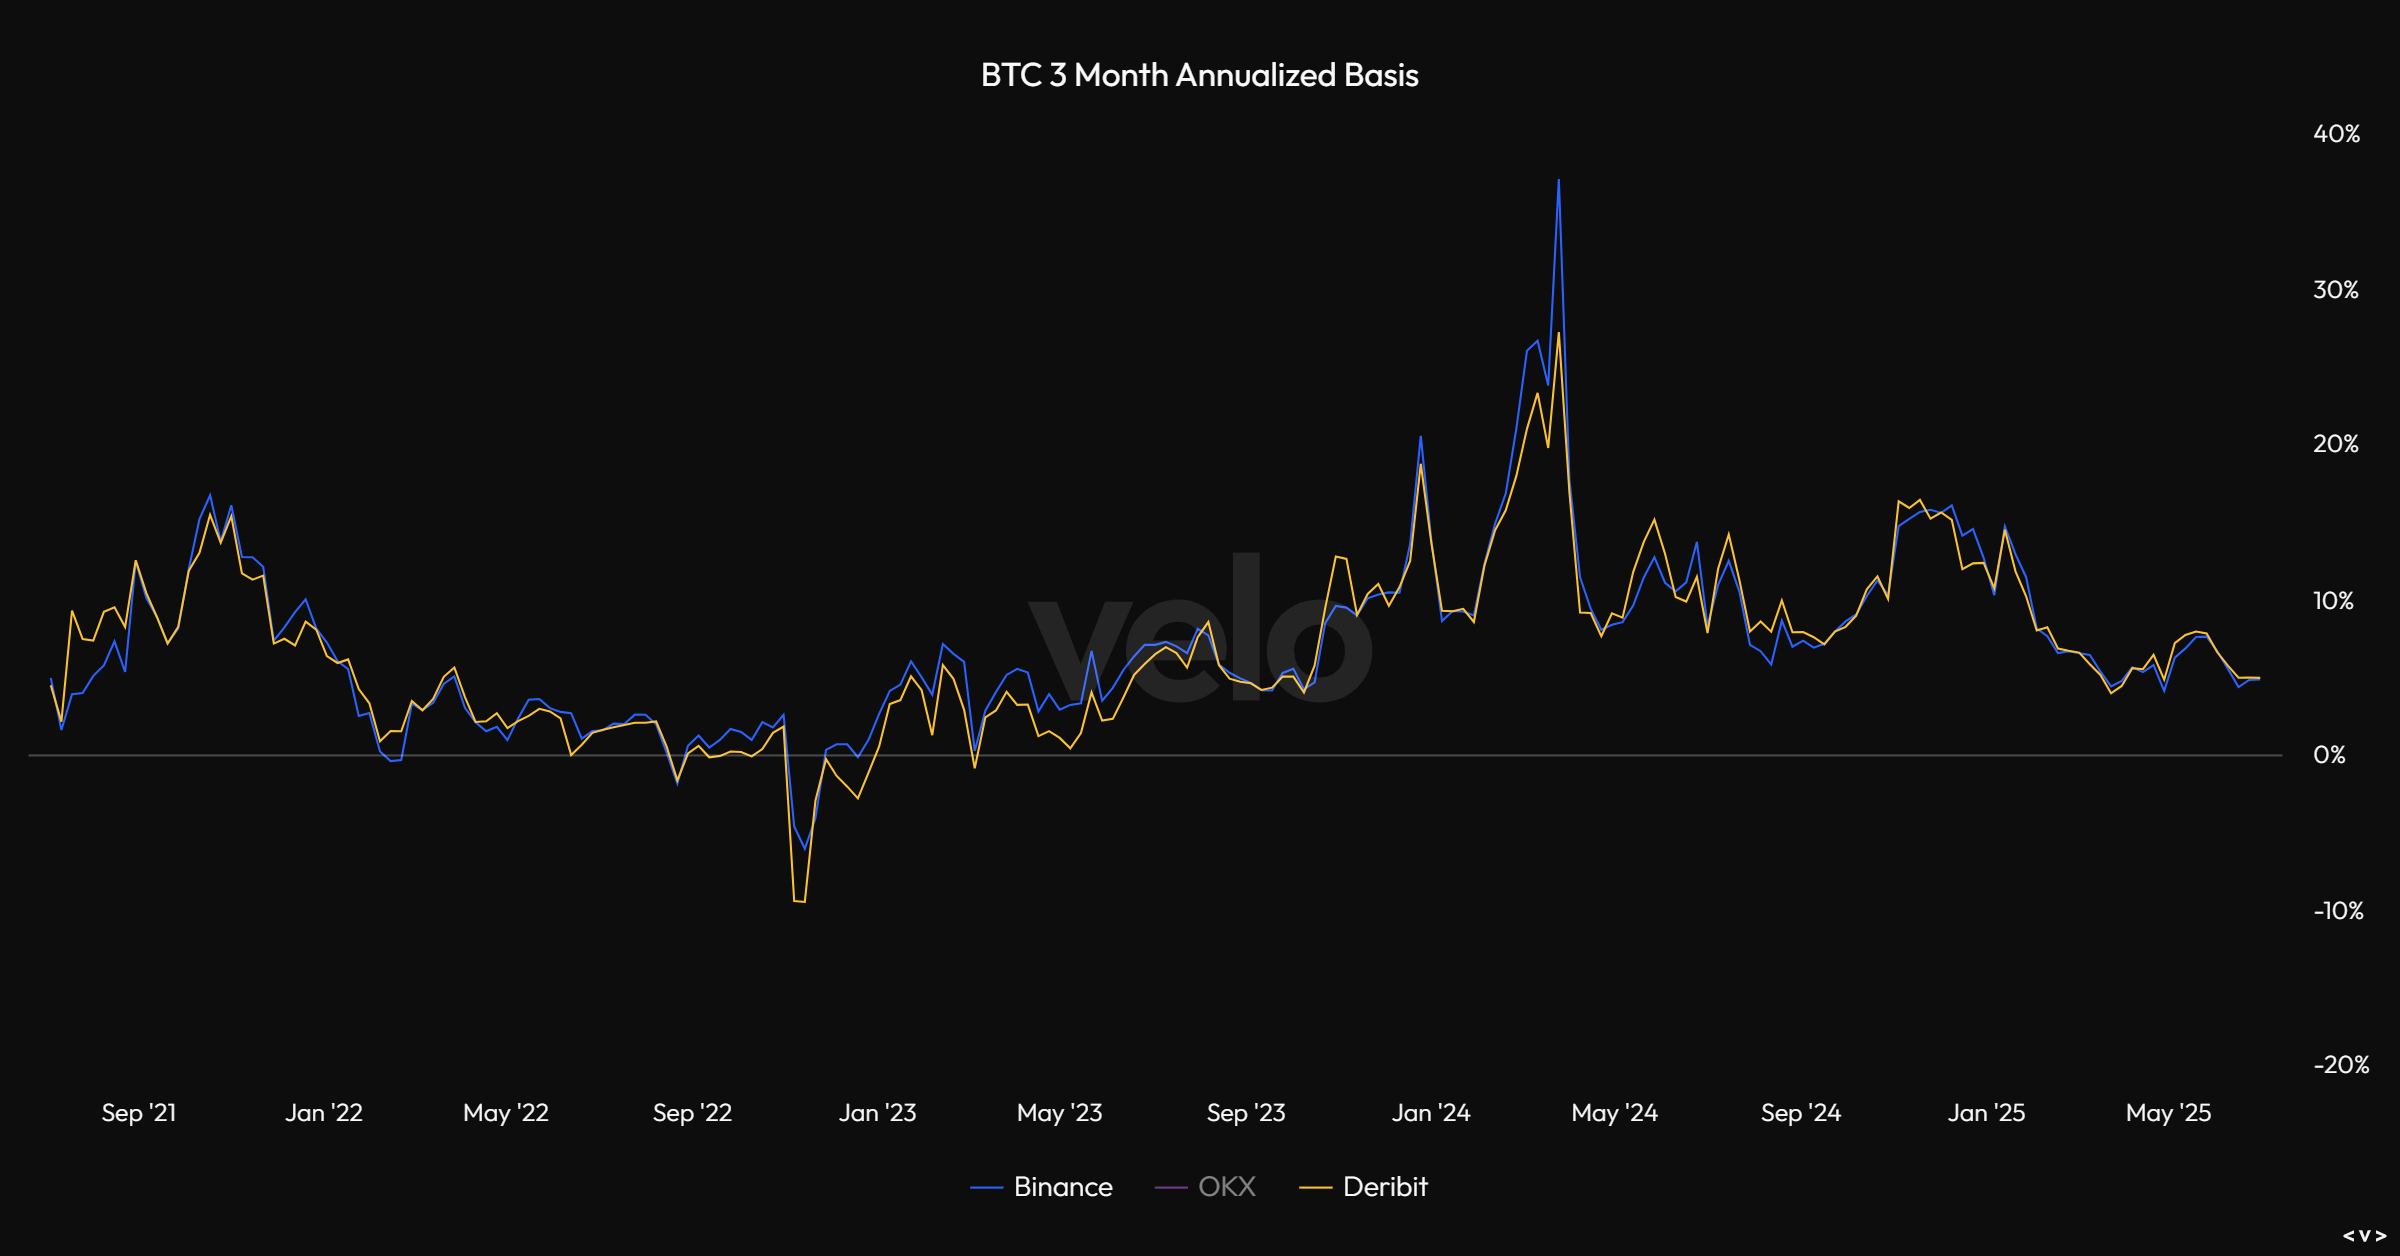
And here's 3-month annualized basis:
And Bitcoin OI vs Altcoin OI:
And finally some of the expected 1-week and 1-month liquidation levels:
Ethereum:
Price: $2473
ETH/USD
Weekly:
Beginning with the weekly for ETH/USD, we can see that despite that sharp sell-off through the multi-week range support the previous week, price bounced off the weekly open back through $2281 and all the way back into $2500 last week, confirming trendline resistance as support and reclaiming the 200wMA. We now need to see this momentum lead to continuation through $2600, where a weekly close above that level would be the first in several months and would be a clear signal for this move lower having been a bear trap before continuation towards the 2025 open at $3330. Rejection here below $2600 and price closing below $2281 again with momentum still capped would conversely be your all-clear for this being distribution before $1420. The setup is now very straightforward for both trajectories in my view and we're just awaiting acceptance either above $2600 or below $2281 to reveal the next few months of price-action...
Daily:
Turning to the daily timeframe, I have kept in these two trajectories marked out last week, where we have completed the bounce portion of both trajectories off that reclaimed support into $2530, right around the 200dMA and the June open. It is now a case of either forming a higher-low, flipping this overhead cluster of resistance into support and then pushing higher, or losing that 2024 open on the next test and breaking fresh lows through $2158 that would lead to $1747 being retested swiftly, before continuation lower into $1420 most likely. Daily RSI is still trending lower, so a breakout above $2600 that coincides with a trendline break on momentum would be promising for bulls, with $2850 the next target followed by $3330. Ultimately, if we accept above this massive cluster of resistance, I think it becomes quite probable that we go all the way back to the 2024 highs at $4093, to be honest.
ETH/BTC
Weekly:
Looking at the weekly for ETH/BTC, we can see that price did bounce last week after losing key support to close right back at that 0.023 support level, which is moderately promising but could well just be the breakdown retest before continuation lower in July. If this is the case, we should see price reject here this week and move below last week's low, following which I would be expecting the near-full retrace into 0.0185 to follow. Conversely, if this is ETH/BTC marking out its higher-low around key support, we should see 0.023 defended and price push higher from here to close firmly back above the level, and then continue to push through 0.0264 next week, where I would then expect July to be very strong for ETH with a much sharper reversal into 0.0294 as the first target, followed by 0.036. Keep an eye on weekly momentum here.
Daily:
Again, dropping into the daily we can see the two probable trajectories I marked out last week, with us still consolidating around that key pivot. This is where bulls need to step in and reclaim 0.0231 as support throughout this week, as this level acting as resistance and leading to a breakdown below 0.0215 would make the bearish path much more likely. I think much is dependent on Bitcoin accepting above $112k here, where that would act as the signal for a broader risk-on July, whereas rejection and acceptance back below $104k likely leads to ETH/BTC showing further weakness.
Subscribe to Ostium Labs
Receive the latest updates directly to your inbox
Your subscription could not be saved. Please try again.
Your subscription has been successful.
DXY:
Price: $96.71
Weekly:
If we begin by looking at the weekly for the Dollar Index, we can see that price has pretty much perfectly followed that 2016 Trump fractal I highlighted back in January, just at a faster pace than back then, and we have now confirmed loss of the multi-year range support and the 2023 lows following last week's close. Momentum is not showing any signs of exhaustion now following the more recent weakness and price is sat right on minor resistance turned support, with a huge gap below into the next major level at 94.7. Given this structure and momentum, it is hard to expect anything except continued dollar weakness, but given the historical short positioning I simultaneously do not think it is wise to look for direction short exposure on the Dollar right here. I would be much more keen to look for further downside in the dollar if we got a short squeeze that rinsed some of this positioning out, but nothing in price-action is suggestive of that yet. Looking ahead, I think it is very likely we get another steep leg lower into that 93.1-94.7 region, but I do not share the view at present that the structural dollar bull market is over and fully expect another higher-low to form above those Covid lows at 89.7, from which we see another extension higher in DXY sometime in 2026 going into 2027.
Daily:
Looking at the daily, we can see that momentum here is also bearish with no exhaustion present and daily structure is printing lower-highs and lower-lows. We should thus see any bounce capped by local trendline resistance at 98.3, and DXY push through this support towards 94.7 over the coming weeks. The first sign that a short squeeze is on would be acceptance back above the 2023 lows at 99, turning daily structure bullish. Until then, this continued dollar weakness should continue to provide tailwinds for both growth via financial conditions and risk appetite.
SPX:
Price: $6203
Weekly:
And there we have it - equities closing at fresh all-time highs last week through $6152 into $6182. This was unthinkable in early April and continues to be buoyed by a perpetual wall of worry and underweight positioning. Buying that early April weakness in equities with confidence has been my trade of the year so far and despite us no longer being early given we are literally in price discovery, sentiment and positioning remains favourable for holding longs and I expect July to be strong for SPX. If we look at all manner of data relevant to the v-reversal and the strength of May and June, the forward returns are very strong. Now that we have closed at fresh highs, I expect the dips to continue to be shallow until sentiment and positioning play catch up and then we can think about a potential 10% correction. Onwards and upwards.
Daily:
Looking now at the daily, we can see that momentum broke to fresh highs after that upwards grind and taking a fib extension of the local trend gives us $6257 as potential resistance, followed by $6460. Daily structure is obvious bullish and I would expect that 2025 open at $5906 to be protected on a retest, where closing below that would mark a structural shift again. Until we see that, or we see higher timeframe exhaustion much higher up, just keep riding the disbelief higher. Nothing else to add here.
Others:
Price: $233.1bn
OTHERS/USD
Weekly:
If we begin by looking at OTHERS on the weekly, I'll keep things super simple on this timeframe: we are in a multi-year uptrend that put in another higher-low in April. This does not mean much for the vast majority of alts, as OTHERS is the top 125 altcoins excluding the top 10, and as we know from OTHERS/BTC altcoin selection continues to be of paramount importance in order to participate in upside; but it does mean that the dollar value of the largest midcaps structurally bullish. If we lose that April low, this multi-year structure shifts bearish on this timeframe, so $175bn is a pretty key level. Last week we marked out what currently looks like a higher-low above the 200wMA at $211bn, bouncing off that support to close at $238bn. If this is bullish structure, we should see continuation higher here back towards the May highs at $300bn, acceptance above which then opening up another test of $426bn, with the all-time high above that at $490bn. Losing last week's low would be the clearest sign to expect nothing of alts in summer except a retest of $175bn, which I would expect to hold.
Daily:
Turning now to the daily, we can see these two trajectories marked out, where a higher-low formation into early July followed by a trendline breakout and acceptance above $253bn (the 360dMAand the high that preceded the April low) would open up a strong July into a yearly open retest at $335bn, with momentum then turning higher after this multi-week downtrend; conversely, price rejecting at the June open and breaking back below the May open at $223bn, turning that level into resistance, would suggest further downside ahead in July for OTHERS, with $175bn then looking like a magnet for summer re-accumulation. We do have a marginal momentum breakout here but we need to see something more convincing, alongside daily structure turning bullish to really get excited.
OTHERS/BTC
Weekly:
Now, looking at OTHERS/BTC, this is the chart that shows the true weakness of alts since January 2022, and as I mentioned a few weeks ago there is still nothing to suggest the trend has shifted, with momentum and structure bearish and the market putting in fresh lows. We remain in no man's land above that Dec 2020 support but below key local support turned resistance, and we will only see breadth of outperformance return in alts when this chart starts reclaiming lost support. That red box highlighted is the main one: flip 3mn BTC into support and I would expect a much sharper rally from there for OTHERS/BTC - until then only the strong will survive and thrive.
Daily:
Finally, looking at the daily we can see that you have some marginal trend exhaustion into last week's low and if bulls can step in here and break beyond trendline resistance we have a nice local low. I think it is more likely that we see another sweep of 2.08mn BTC as BTC accepts above $112k and then we get that broader risk on and the beginnings of a structural shift in OTHERS/BTC. The bearish path would be BTC rejecting price discovery and breaking lower, and OTHERS/BTC is then likely to push lower again through July.
I hope you've found some value in the read this week!
And if you've not already signed up for Ostium, please do so and test out some of the recent updates, including:
On-chain leverage for indices including NDX, SPX, FTSE & more...
Unified accounts and gas-free trading
Single-stock perpetuals, including TSLA, NVDA and META


-2025-06-30_08_23_49.png)
-2025-06-30_08_24_38.png)


